The holiday season is almost here, and knowing how each generation plans to shop can give your holiday advertising campaigns the edge you need. Our recent survey of 1,000 U.S. consumers reveals 2024 holiday shopping trends for each generation and key insights into their anticipated spending levels, preferred shopping categories, and how they look for gift ideas.
In this blog post, we’ll explore three 2024 holiday shopping trends across generations:
- Projected consumer spending
- Top categories on shoppers’ lists
- Preferred channels for researching gifts
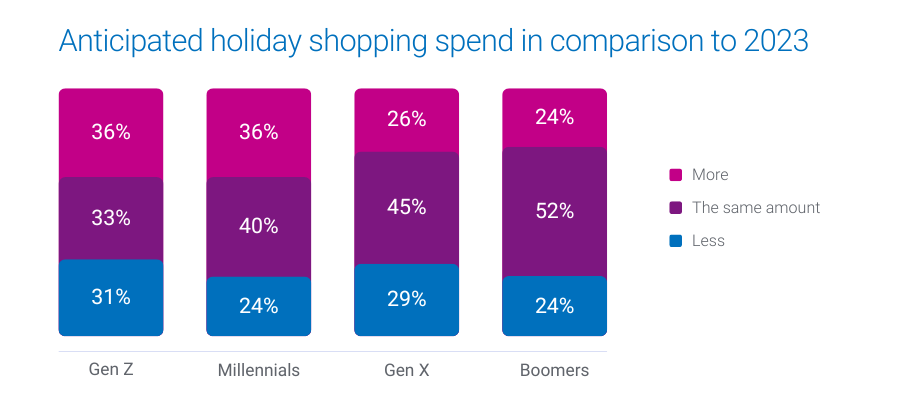
1. Projected consumer spending
Over 1 in 3 Gen Z and Millennials are gearing up to increase their holiday budgets this year, while Gen X and Boomers are likelier to stick to last year’s budget.
- 36% of Millennials and Gen Z plan to spend more this holiday season
- 45% of Gen X and 52% of Boomers expect their spending to remain consistent with last year
What this means for marketers
These insights highlight the importance of tailoring your messaging. For Gen Z and Millennials, emphasize value and unique offerings that justify increased spending. For Gen X and Boomers, focus on trust and reliability, reinforcing their confidence in your brand.
How Experian can help you target these audiences
Experian’s custom and syndicated audience segments, including Holiday Shopper High Spenders and Holiday Shopper Moderate Spenders, enable you to connect with these diverse consumer groups. Our audiences are available on-the-shelf of leading ad platforms to help you reach people across social, TV, and mobile.
The election effect
U.S. holiday retail sales saw 4.1% YoY growth in 2016 and 8.3% YoY growth in 2020 following presidential elections. There’s a chance that holiday spending increases after the 2024 election, regardless of the outcome. Experian has 240+ politically relevant audiences that you can activate across major ad platforms ahead of the upcoming election.
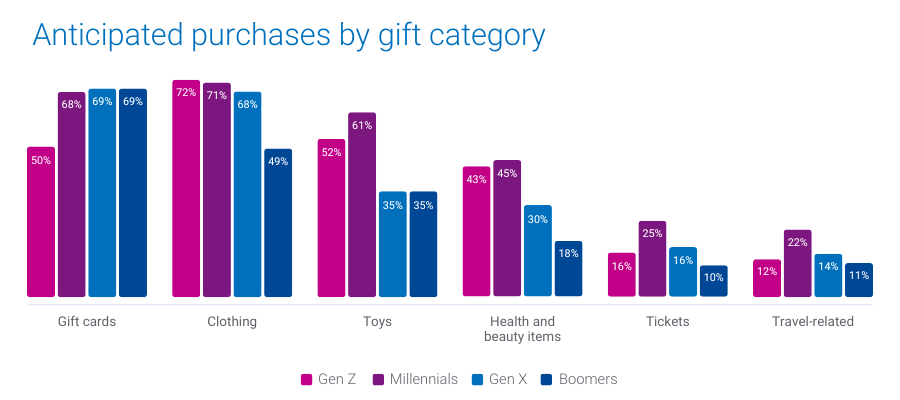
2. Top categories on shoppers’ lists
Different generations have distinct preferences when it comes to what they plan to buy. Gift cards top the list for Gen X and Boomers, while Gen Z leans toward clothing. Millennials are looking to splurge on toys, electronics, and experiences.
- 69% of Boomers and Gen X plan to purchase gift cards
- 72% of Gen Z will buy clothing
- 45% of Millennials will buy health and beauty items
- 25% of Millennials will buy tickets and 22% of Millennials will buy experiences
What this means for marketers
Align your product offerings and promotions with each generation’s preferences to capture their attention. For example, highlighting versatile gift cards may resonate more with older generations, while showcasing trendy apparel and tech gadgets will appeal to younger consumers.
How Experian can help you target these shoppers
We offer audience segments like Holiday Shoppers: Apparel, Cosmetics & Beauty Spenders, and Toys Shoppers that you can activate to connect with consumers primed to purchase in these categories.
We recently released 19 new holiday shopping audiences we recommend targeting to drive engagement and conversions. Download our audience recommendations here.
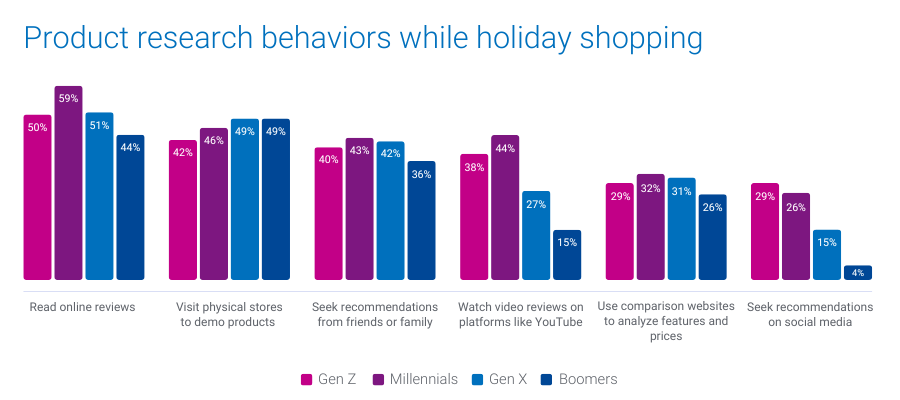
3. Preferred channels for researching gift ideas
When it comes to finding the perfect gifts, Gen Z turns to social media, while Millennials prefer online reviews and video content. Boomers and Gen X are more inclined to visit physical stores for hands-on product evaluations.
- 29% of Gen Z and 26% of Millennials will look for gift ideas on social media
- 44% of Millennials will rely on video reviews and product demos on platforms like YouTube
- 49% of Gen X and Boomers plan to visit physical stores to evaluate products in person
What this means for marketers
Understanding where each generation looks for inspiration can guide your content and ad placement strategy. To engage Gen Z, focus on social media campaigns and influencer partnerships. For Millennials, consider investing in video content and reviews. For older generations, ensure your in-store experience is optimized to convert browsing into purchases.
How Experian can help you engage these shoppers
Our TrueTouchTM audiences can help you pair the perfect messaging styles with the right channels and calls to action. Our Social media channel and content engagement audiences can help you reach Gen Z who are likely to be active users on major social platforms and are Black Friday shoppers. For a full list of Experian’s syndicated audiences and activation destinations, download our syndicated audiences guide.
Download our report for five 2024 holiday shopping trends by generation
Understanding 2024 holiday shopping trends by generation can help you tailor your targeting, messaging, media planning, and creative based on the generation you’re targeting.
In addition to the insights covered here, download our 2024 Holiday spending trends and insights report to learn:
- When consumers plan to shop (hint: they’re already shopping)
- Where they plan to shop (online vs. in-store)
Download our full report to access all five of our predictions by generation, so you can address the diverse needs of this year’s holiday shoppers.
When you work with Experian for your holiday shopping campaigns, you’re getting:
- Accurate consumer insights: Better understand your customers’ behavioral and demographic attributes with our #1 ranked data covering the full U.S. population.
- Signal-agnostic identity solutions: Our deep understanding of people in the offline and digital worlds provides you with a persistent linkage of personally identifiable information (PII) data and digital IDs, ensuring you accurate cross-device targeting, addressability and measurement.
- Secure connectivity: Bring data and identity to life in a way that meets your needs by securely sharing data between partners, utilizing the integrations we have across the ecosystem, and using our marketing data in flexible ways.
Make the most of this holiday shopping season with Experian. Contact us today to get started.
Source
Online survey conducted in June, 2024 among n=1,000 U.S. adults 18+. Sample balanced to look like the general population on key demographics (age, gender, household income, ethnicity, and region).
Latest posts

While the weather outside is frightfully hot this summer, it’s never too soon to start thinking about the holidays – and consumers are more likely to start their holiday shopping early this year. To get you ready for the 2022 holiday shopping season, we looked back at consumer shopping trends from 2019-2021. What did we learn and what trends do we expect to see this year? Let’s look back. A look back Over the last three years, average consumer spending has increased. Record 2021 holiday sales came amidst a wave of COVID-19 cases, rising inflation, labor shortages, and supply chain problems. Despite these challenges, consumers continued to let it snow when it came to spending during the holiday season. 2022 has been a year with its own economic roadblocks – the war in Ukraine, rising gas prices, and recession concerns. Yet 2021 was a banner year for holiday sales despite its obstacles, and we predict similar trends in the 2022 holiday shopping season. What trends do we expect to see for the most wonderful time of the year? 2022 predictions While consumer spending remains strong, changing economic conditions continue to shape shopper behavior. To develop our predictions for 2022 holiday shopper behavior, we focused on four key areas: When consumers shop Where consumers shop What consumers purchase Consumer media preferences Now, let's make our holiday campaign planning checklist and check it twice. When consumers shop Chestnuts roasting on an open fire. Jack Frost nipping at your nose. Those aren’t the only ways to know when the holiday season has begun. Shoppers tend to spread out their holiday purchases across multiple months and were more likely to start shopping earlier. To understand holiday retail sales trends from 2019-2021, we identified four shopper segments: Early Shoppers Traditional Shoppers Late Shoppers Random Shoppers What differences did we see between our four shopper segments? Early shoppers made almost half of their holiday purchases in October Random shoppers spread out their holiday purchases evenly across multiple months Late shoppers made almost half of their holiday purchases in December Traditional shoppers made almost half of their holiday purchases in November While December continues to dominate holiday sales, October has started to gain traction over the last three years, and November remains a core shopping month. Everybody knows a turkey and a mistletoe help to make the season bright but knowing when your consumers are most likely to shop will help deck your campaign planning halls. Jingle bell rock your way to holiday sales that shine bright with our tips to prepare for earlier shoppers: Offer targeted promotions earlier in the shopping season Target your ads based on the shopping habits of your customers throughout the season Where consumers shop There’s no place like home for the holidays but most consumers aren’t shopping from home. Despite the rise in online shopping, brick and mortar locations continue to dominate holiday sales. October is the most popular month to take a one-horse open sleigh to a store, and consumers gather around the fire to online shop in November and December. With most shoppers preferring to shop in-store, and e-commerce popularity growing, it’s critical to think about bridging the gap between your online and offline presence for the consumer. Are you offering multiple paths to purchase with solutions such as BOPIS (Buy Online, Pickup In-Store)? Go down in history like Rudolph with our tips to prepare for more in-store shopping: Focus on in-store shopping experience technology (self-checkout, VR, QR codes, scan to pay, etc.) Offer multiple paths to purchase to connect your online and physical presence through methods such as BOPIS (Buy Online, Pickup In-Store), BORIS (Buy Online, Return In-Store), and ROPO (Research Online, Purchase Offline), etc. What consumers purchase When it comes to holiday gifts, for some, only a hippopotamus will do. Compared to pre-pandemic, shoppers are spending more at apparel stores and mass retailers. Spending at specialty retailers, warehouse clubs, and on office, electronic, and games is almost the same across holiday and non-holiday shopping months. Time for toys and time for cheer may be year-round, but are there any correlations between where consumers shop (online vs. in-store) and what they purchase? Our data found that shoppers who bought from mass retailers were more likely to shop online, while shopping for apparel and warehouse clubs was done at a physical store location. Put this insight to the test by thinking through how you can target your consumer based on where they shop in-store and online. You just might find that hippopotamus at a brick and mortar mass retailer location! Consumer media preferences Do you see what I see? While we are seeing a shift to digital media channel preference, consumers still engage with traditional media channels like direct mail and the traditional newspaper. Successfully connecting with your customers involves capturing their attention through the right channel. We found that our four shopping groups prefer a mix of traditional and digital media channels. What does your media channel mix look like? Hark! The herald angels sing of ways to adapt to the change in holiday spend and media preferences: Align your activation efforts to digital, but don't forget about traditional channels Expand your targeting and activation focus beyond in-store vs. online Download our new 2024 report For a deeper dive into our predictions and actionable insights you can use to take your holiday campaign planning home for the holidays, download our new 2024 report. Experian data can help you refine your content and creative strategy to achieve maximum ROI for each campaign across all your channels. Download now

Fluctuation in consumers' behaviors and preferences during the pandemic has prompted a shift in the practices and patterns that we are accustomed to. Powerful market forces are emerging as society builds a new normal, forcing marketers to rethink their strategy, activation, and measurement. It is important for marketers to understand the forces that influence the industry, and to learn about alternative approaches that can be applied to help reach their goals. In our recent webinar, ‘How to Adjust to the New World of Advertising,’ Experian’s Chris Feo and guest speaker Tina Moffett, Principal Analyst at Forrester Research, lead an in-depth discussion of the market dynamics and developments guiding us to this new era of advertising. They talked about: The pandemic changing consumer behavior Emerging media channels Data deprecation The pandemic and increased media consumption The pandemic caused seismic shifts in consumer behaviors and business operations. Work from home became the norm, consumers made drastic changes in their routines, and businesses had to adjust to new operating models as local economies shrank and supply chains strained. As stay-at-home orders were put into effect, consumers increased their media consumption drastically as more time was spent at home in front of their devices. According to Forrester, by June 2020, 48% of US online adults subscribed to at least one streaming service, while 34% had signed up for multiple. Forrester contends that: Social and online video/OTT will grow fastest among other categories of ad spend Connected TV outpaces other video advertising channels 55% of consumers plan to continue watching movies at home rather than in theatres after the pandemic Data deprecation The ways that marketers can personalize content and measure the effectiveness of campaigns is changing with data deprecation. Consumer preferences, regulations, and technology providers are evolving the way advertisers understand consumers, causing changes to existing identity-based marketing strategies. According to Forrester, 66% of marketers are investing in first-party data collection strategies to adapt to these market forces. Marketers need to adjust Demand for a new advertising approach Changes in consumer behavior, evolving media consumption patterns, and data deprecation have marketers looking at new approaches to targeting and measurement. However, with the future uncertain in many of these areas, marketers need to test and experiment to determine which approach is best for them in particular use cases. Shifting to a new world of experimentation Advertisers need to start by assessing their current environment to determine where they have exposure today, which methods of identification they are using, and how those channels may be impacted by the market forces outlined earlier. From there, they need to start asking themselves how they can assess identity in the future or if there is another way to approach advertising in that specific channel. There are specific areas where marketers can look to make investments in terms of experimentation: Adoption of cleanrooms to support analytics and audience targeting Investment in first-party data to overcome the issue of data deprecation Shifting to a value-based, omni-channel advertising mindset to address customers’ needs Investment in data-savvy resources to manage media insights Adoption of consistent cross-platform advertising metrics and currencies to inform better planning If you missed our recent webinar ‘How to Adjust to the New World of Advertising,’ you can listen to the full discussion here.

Hashed Email is a privacy-safe digital identifier that can further enrich and expand the functionality and utility of The Tapad Graph with access to Tapad + Experian’s universe of email data. This provides maximum coverage for targeting and measurement when combined with household and individual IDs such as Cookies, MAIDs, CTV IDs, and IP Addresses. Gain back a clearer view Recent data from DMA shows that 51% of people have held the same email address for over 10 years. Email address data by its nature is authenticated and reliable due to its longevity. When leveraging Hashed Email as an extended functionality of The Tapad Graph, we are able to link on average 5 email addresses to each individual, reaching up to 90% of households across the US. Hashed Email expands the customer view by adding new email address identifiers into The Tapad Graph that associate with traditional digital IDs and cookie-less IDs emerging in the marketplace. Reduce fragmentation; and instead of viewing the emails as multiple customers, with Hashed Email they can be viewed as one user profile. When enabled, clients who wouldn’t traditionally have access to first-party customer emails are able to associate and link privacy-safe emails to individuals and their households. Brands and retailers can use Hashed Email to extend these linkages across offline purchases associated with each email; connecting traditional digital identifiers between walled gardens, activation in programmatic media buys, and addressable TV. With the holiday season quickly approaching, access to Hashed Emails will instantly increase scale, connectivity and improve measurement when efficiency, personalization and holistic attribution are pivotal to marketing strategies. Let’s visualize how quickly the customer journey can become fragmented when email addresses that belong to the same person are not associated. Mary has 3 email addresses that she frequently uses. One for social media accounts Email ID 1, one for shopping accounts Email ID 2, and another for work Email ID 3. Mary is a brand loyalist to a top national retailer and whenever there is a new season, there is a high likelihood that she will purchase the latest seasonal decor from that store. She recently did some holiday shopping in-store where she purchased nearly the whole holiday line. Email ID 2 was used to send her a receipt. However, Mary annoyingly receives the store's ads on Facebook for holiday decor that she had already purchased. This is because the retailer has not yet identified that Email ID 1 and Email ID 2 belong to the same consumer. If the retailer were to leverage Hashed Email, they would be able to identify that both email addresses used belong to Mary. This association connects her multiple email addresses together, enables her offline purchases to sync with her online activity, and helps to determine the most accurate ROAS. Hashed Email is a cookie-free added view into consumer behavior for control over messaging and for measurement. When leveraging it’s possible to report back across all channels and devices in a universal format to know when and how conversions are taking place. Don't leave valuable data on the table Hashed Email has use cases beyond reducing wasted media impressions. Hashed Email’s full capabilities extend to campaign measurement and attribution modeling. When utilizing The Tapad Graph combined with Hashed Email, know from the first touchpoint to the last where your customers are engaging. But more importantly, know where households and the individuals inside of those households are converting across all of their digital devices, by using traditional digital IDs, cookie-less IDs, and Hashed Email to associate, measure, and correlate online and offline purchases. Imagine what your campaigns could look like this holiday season if you expanded your graph with up to 5 additional IDs per household. This impact could be a game-changer to scale this holiday season. Hashed Email is a reliable cookie-less digital identifier that expands your customer universe that connects online and offline activity while improving the customer experience and reducing wasted media spend. Enabling Hashed Email for the holiday season is not an opportunity that should be passed on. Where do you sign up, you ask? Get started with The Tapad Graph For personalized consultation on the value and benefits of The Tapad Graph for your business, email Sales@tapad.com today!