
The holiday season is almost here, and knowing how each generation plans to shop can give your holiday advertising campaigns the edge you need. Our recent survey of 1,000 U.S. consumers reveals 2024 holiday shopping trends for each generation and key insights into their anticipated spending levels, preferred shopping categories, and how they look for gift ideas.
In this blog post, we’ll explore three 2024 holiday shopping trends across generations:
- Projected consumer spending
- Top categories on shoppers’ lists
- Preferred channels for researching gifts
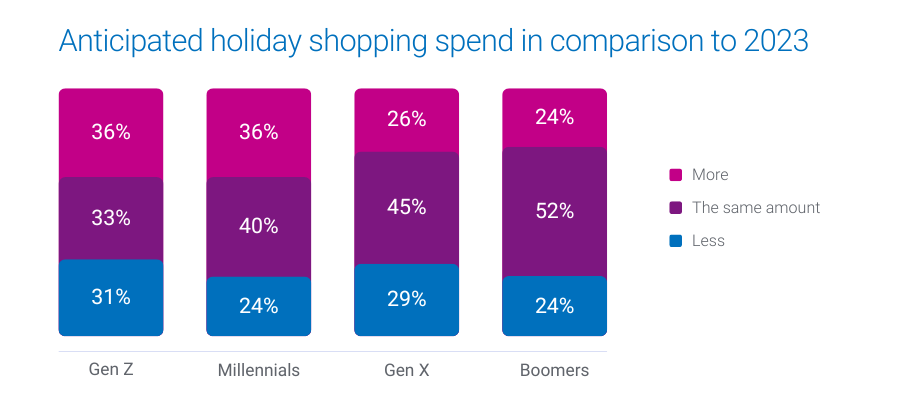
1. Projected consumer spending
Over 1 in 3 Gen Z and Millennials are gearing up to increase their holiday budgets this year, while Gen X and Boomers are likelier to stick to last year’s budget.
- 36% of Millennials and Gen Z plan to spend more this holiday season
- 45% of Gen X and 52% of Boomers expect their spending to remain consistent with last year
What this means for marketers
These insights highlight the importance of tailoring your messaging. For Gen Z and Millennials, emphasize value and unique offerings that justify increased spending. For Gen X and Boomers, focus on trust and reliability, reinforcing their confidence in your brand.
How Experian can help you target these audiences
Experian’s custom and syndicated audience segments, including Holiday Shopper High Spenders and Holiday Shopper Moderate Spenders, enable you to connect with these diverse consumer groups. Our audiences are available on-the-shelf of leading ad platforms to help you reach people across social, TV, and mobile.
The election effect
U.S. holiday retail sales saw 4.1% YoY growth in 2016 and 8.3% YoY growth in 2020 following presidential elections. There’s a chance that holiday spending increases after the 2024 election, regardless of the outcome. Experian has 240+ politically relevant audiences that you can activate across major ad platforms ahead of the upcoming election.
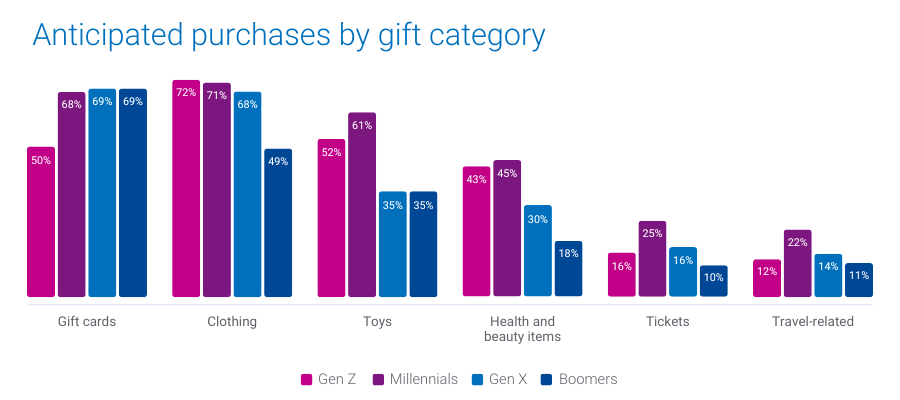
2. Top categories on shoppers’ lists
Different generations have distinct preferences when it comes to what they plan to buy. Gift cards top the list for Gen X and Boomers, while Gen Z leans toward clothing. Millennials are looking to splurge on toys, electronics, and experiences.
- 69% of Boomers and Gen X plan to purchase gift cards
- 72% of Gen Z will buy clothing
- 45% of Millennials will buy health and beauty items
- 25% of Millennials will buy tickets and 22% of Millennials will buy experiences
What this means for marketers
Align your product offerings and promotions with each generation’s preferences to capture their attention. For example, highlighting versatile gift cards may resonate more with older generations, while showcasing trendy apparel and tech gadgets will appeal to younger consumers.
How Experian can help you target these shoppers
We offer audience segments like Holiday Shoppers: Apparel, Cosmetics & Beauty Spenders, and Toys Shoppers that you can activate to connect with consumers primed to purchase in these categories.
We recently released 19 new holiday shopping audiences we recommend targeting to drive engagement and conversions. Download our audience recommendations here.
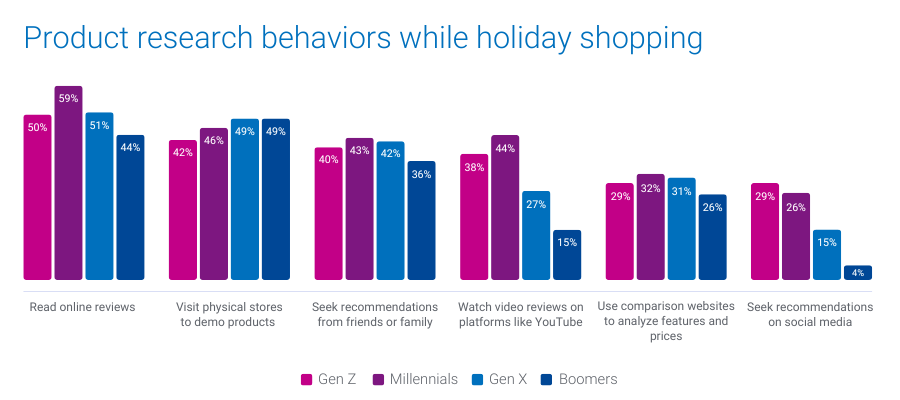
3. Preferred channels for researching gift ideas
When it comes to finding the perfect gifts, Gen Z turns to social media, while Millennials prefer online reviews and video content. Boomers and Gen X are more inclined to visit physical stores for hands-on product evaluations.
- 29% of Gen Z and 26% of Millennials will look for gift ideas on social media
- 44% of Millennials will rely on video reviews and product demos on platforms like YouTube
- 49% of Gen X and Boomers plan to visit physical stores to evaluate products in person
What this means for marketers
Understanding where each generation looks for inspiration can guide your content and ad placement strategy. To engage Gen Z, focus on social media campaigns and influencer partnerships. For Millennials, consider investing in video content and reviews. For older generations, ensure your in-store experience is optimized to convert browsing into purchases.
How Experian can help you engage these shoppers
Our TrueTouchTM audiences can help you pair the perfect messaging styles with the right channels and calls to action. Our Social media channel and content engagement audiences can help you reach Gen Z who are likely to be active users on major social platforms and are Black Friday shoppers. For a full list of Experian’s syndicated audiences and activation destinations, download our syndicated audiences guide.
Download our report for five 2024 holiday shopping trends by generation
Understanding 2024 holiday shopping trends by generation can help you tailor your targeting, messaging, media planning, and creative based on the generation you’re targeting.
In addition to the insights covered here, download our 2024 Holiday spending trends and insights report to learn:
- When consumers plan to shop (hint: they’re already shopping)
- Where they plan to shop (online vs. in-store)
Download our full report to access all five of our predictions by generation, so you can address the diverse needs of this year’s holiday shoppers.
When you work with Experian for your holiday shopping campaigns, you’re getting:
- Accurate consumer insights: Better understand your customers’ behavioral and demographic attributes with our #1 ranked data covering the full U.S. population.
- Signal-agnostic identity solutions: Our deep understanding of people in the offline and digital worlds provides you with a persistent linkage of personally identifiable information (PII) data and digital IDs, ensuring you accurate cross-device targeting, addressability and measurement.
- Secure connectivity: Bring data and identity to life in a way that meets your needs by securely sharing data between partners, utilizing the integrations we have across the ecosystem, and using our marketing data in flexible ways.
Make the most of this holiday shopping season with Experian. Contact us today to get started.
Source
Online survey conducted in June, 2024 among n=1,000 U.S. adults 18+. Sample balanced to look like the general population on key demographics (age, gender, household income, ethnicity, and region).
Latest posts

As partnership deals mount, aggressive hiring underway for unified cross-screen technology leaders NEW YORK, July 19, 2016 /PRNewswire/ — Tapad, the leader in cross-device marketing technology and now a part of Experian, has announced plans for aggressive expansion in the Asia Pacific (APAC) region. This move capitalizes on Tapad's exceptional performance for brands and marketing technology companies in North America and Europe. With it's proprietary Tapad Device Graph™, the company will enable global, regional and local clients and partners to understand, monetize and measure marketing to users across screens. The Tapad Device Graph is recognized as the most accurate, scalable cross-screen solution in the market today. The decision to expand into APAC was based on increased demand from global, as well as local, brands and clients, many of which have a strong market presence throughout the region. In addition to expanding its roster of world-class data partners, plans include building a world-class team in Singapore. Over the next few months, Tapad APAC will also establish local entities in additional markets. To accelerate its ramp-up, Tapad APAC is actively recruiting in many areas, ranging from skilled and experienced solutions engineers to seasoned sales and marketing professionals. "Tapad is thrilled to be answering the call for cross-device excellence in APAC," said Pierre Martensson, GM of Tapad APAC. "Our Device Graph is adding millions of devices daily and achieves unmatched levels of scale and accuracy while protecting consumer privacy. This meets a critical need in the region." Tapad appointed Martensson as General Manager of Tapad APAC in May, kicking off expansion in the region. Martensson comes to Tapad with nearly a decade of operations experience throughout APAC, having transformed, developed and grown global organizations. To learn more about partnership and employment opportunities available with Tapad in APAC, visit www.experian.com/careers. Contact us today!
Combined technology gives marketers an enhanced view of the customer for improved planning, targeting and optimization NEW YORK, July 12, 2016/PR Newswire/ - Tapad, the leader in cross-device marketing technology and now a part of Experian, today announced a partnership with Conversion Logic, the martech industry's most accurate unified marketing attribution provider. Conversion Logic will incorporate unified cross-screen data from Tapad's Device Graph™ to identify related devices and media exposures to enhance reporting on the path to conversion. By connecting Conversion Logic's proprietary Ensemble Method, which combines numerous state-of-the-art machine learning algorithms, tuned for each customer use-case for the most accurate results, with Tapad's unified, cross-device technology, marketers will benefit from a highly scientific approach to assessing advertising effectiveness with full, comprehensive customer insights. Linking these technologies will increase marketers' real-time ability to optimize brands' marketing channel spend and creative at a more granular level. During the past six months, Tapad has rapidly grown its data business, doubling the number of companies integrating the Device Graph™ into their platforms and growing the annualized revenue run rate by 210%. Tapad's highly scalable, cross-device data has been confirmed by Nielsen to be very precise. Tapad augments platforms' and publishers' tech stacks with additional scale and relevancy, granting advertisers amplified targeting and analysis options. The growth of the Device GraphTM has allowed Tapad to provide a growing network that benefits all partners with more efficient, effective consumer engagement. "Combining highly accurate data from Tapad with our own user ID technology and understanding how devices may be related at an individual level provides additional visibility into the path to conversion," said Alison Lohse, COO and co-founder of Conversion Logic. "The more we know about the customer journey, the more effective, efficient and customized marketers can be with marketing efforts. With Tapad, we have achieved a unified customer view that helps us piece together the purchase journey while preserving proven accuracy." "Conversion Logic's Ensemble Method delivers singularly customized and precise results that are not just accurate, but actionable," said Dave Fall, COO of Tapad. "The combination of powerful technology and a user-friendly interface, plus Tapad's ability to only consider relevant and scalable components in the marketplace, creates a more concentrated and beneficial environment for both its partners and clients." Contact us today!
B2B marketers can now deliver the right message to the right user at the right time across devices and channels NEW YORK, NY–(Marketwired – Jun 1, 2016) – Madison Logic, one of the world's fastest growing companies dedicated to solving the digital needs of B2B marketers, is partnering with Tapad, the leading provider of unified and now a part of Experian, cross-screen marketing technology solutions. Now business-to-business (B2B) marketers can power targeted advertising and content syndication programs across all channels, including smartphones, computers and tablets. The increasing shift in content consumption across mobile devices makes cross-device identification and attribution a top priority for B2B marketers. The Madison Logic and Tapad partnership gives B2B marketers unprecedented reach and scale with the ability to run always-on, cross-device, account-based marketing programs targeting decision makers who are actively researching similar products and services. "Screens are everywhere and so is the B2B buyer," said Vin Turk, SVP of Audience Development for Madison Logic. "This partnership allows marketers to harness the power of Madison Logic's intent data and combine it with Tapad's cross-device solutions to connect with the most-likely-to-convert prospects with hyper-relevant content wherever and whenever they're doing their research." "Relevance is essential to the success of B2B marketers, particularly now, when breaking through the clutter is difficult," said Dave Fall, COO of Tapad. "This partnership with Madison Logic allows marketers to leverage their existing customers while identifying and reaching new audiences with messaging tailored to every device." For more information about Madison Logic's account-based marketing platform, please visit https://www.madisonlogic.com/account-based-marketing/. For more information about Tapad's cross-platform advertising solutions, please visit https://www.experian.com/marketing/consumer-sync. Contact us today!