
Agencies, platforms, and marketers stand at the crossroads of transformation, as privacy regulations tighten, technology accelerates, and consumer behaviors evolve. Yet these challenges also present extraordinary opportunities.
Our 2025 Digital trends and predictions report highlights five trends that will shape 2025 and digs into:
- What’s changing in the market
- How to keep learning about your customers
- How to reach your customers in different places
- How to measure what’s really working along the way
In this blog post, we’ll give you a sneak peek of three of these trends — from cracking the code of signal loss to tapping into the buzz around connected TV (CTV) and stepping up your omnichannel game. Think of it as a taste test before the main course. Ready for the full menu? Download our report to get the lowdown on all five trends.
1. Signal loss: A rich appetizer of alternate ingredients
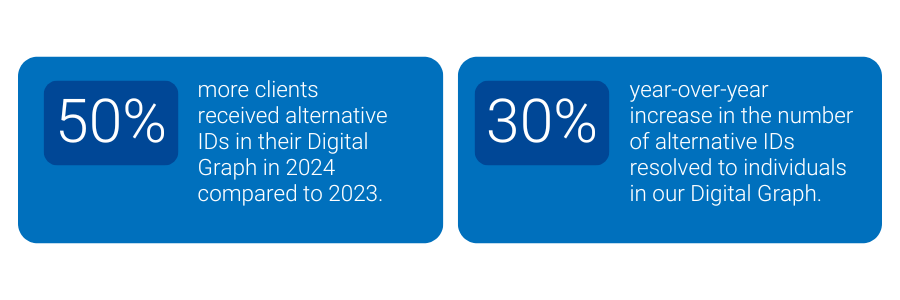
As traditional cookies crumble, marketers need fresh ingredients to keep the flavor coming. Already, about 40% of browser traffic doesn’t support third-party cookies, and marketers are spicing things up with first-party data, alternative identifiers like Unified I.D. 2.0 (UID2) and ID5, and contextual targeting strategies. In fact, 50% more of our clients received alternative IDs (UID2, ID5, Hadron ID) in their Digital Graph in 2024 compared to 2023. The number of alternative IDs resolved to individuals in our Digital Graph increased by 30% year-over-year – as everyone looks beyond the cookie jar.
There is no secret sauce to replace cookies. Instead, expect a multi-ID recipe that brings together different identifiers, unified by an identity graph. This approach turns a fragmented pantry of data into a cohesive meal, giving you a complete view of your customer on every plate.
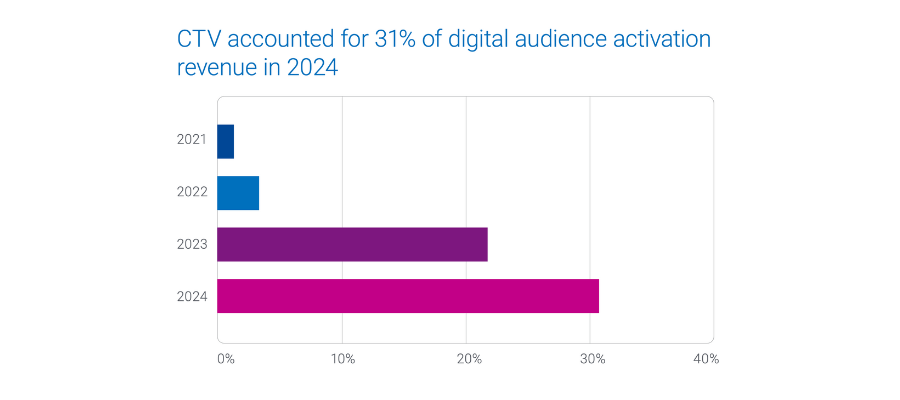
2. The rising power of CTV: A hearty entrée of opportunities
CTV is quickly becoming the main dish on the streaming menu, as viewers load up on their favorite shows. While CTV is slated to make up 20% of daily U.S. media consumption by 2026, advertisers are still holding back on pouring in the ad spend. To unlock its full flavor, marketers need to whip up solutions like frequency capping and unified audience activation.
Although CTV will account for 20% of daily U.S. media consumption by 2026, it’s projected to command only 8.1% of ad spend. Frequency capping and unified audience activation solutions will be key to unlocking CTV’s full potential.
By 2025, nearly half of CTV “diners” will choose free ad-supported streaming TV (FAST). Marketers need strategies to prevent ad overexposure. With 50% of U.S. consumers avoiding products due to ad overload, and 30% of marketers willing to increase their CTV spend if frequency capping improves, unified identity solutions help ensure every impression is served just right.
3. Omnichannel: A flavorful fusion plate
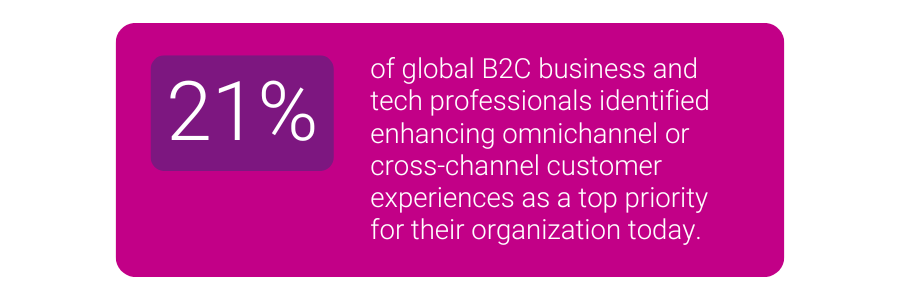
No one likes a one-flavor meal. Marketers are moving beyond single-channel “side dishes” to omnichannel “fusion feasts” that blend direct mail, digital, CTV, and retail media networks (RMNs) into a truly cohesive culinary experience. Even though only 21% of global B2C professionals currently put omnichannel at the top of their shopping list, the growing demand for seamless, audience-first campaigns is heating up.
In 2025, having an audience-first approach will be like having a perfect pairing for every course. Unified identity solutions act as your master sommelier, ensuring that each channel complements the next, and every customer enjoys a well-rounded, memorable journey.
Vertical trends: A dessert sampler from four unique kitchens
Different markets have their own signature flavors.
- In Auto, crossover utility vehicles (CUVs) claim 51% of new vehicle registrations, and consumers in the 35-54 age group and families are the primary buyers. Automotive marketers should prioritize CUV advertising with a strong focus on family-oriented and income-appropriate messaging
- In Financial Services, marketers need to anticipate shifts in consumer behavior tied to economic conditions, such as increasing demand for deposit products when interest rates are high. For insurance, aligning campaigns with life events, like new home purchases or marriage, can maximize engagement.
- In Healthcare, advertisers are prioritizing personalized, regulation-compliant campaigns that address social determinants of health (SDOH).
- In Retail, advertisers are increasingly activating on both CTV and social platforms, with many managing their own in-house campaigns. While larger brands often rely on media agencies, a shift toward in-house media buying is emerging among some bigger players, offering more control over audience targeting and performance metrics.
Our report covers each vertical’s unique menu, helping you select the right “ingredients” for your customers. With the top Experian Audiences on hand, you can create feasts that delight, nourish, and convert.
Hungry for more? Download our full menu
The three “samples” you’ve just tasted are just the starters. Our 2025 Digital trends and predictions report serves up five insights, complete with strategies, data, and tools to help you adapt, scale, and thrive in 2025.
Ready for the full menu? Download our report now and discover all five trends that will shape your marketing “cookbook” in 2025. Bon appétit!
Latest posts

We asked the experts about hashed email. What is email hashing? Do we need to hash email addresses in databases? What can we expect for hashed identifiers?

While the weather outside is frightfully hot this summer, it’s never too soon to start thinking about the holidays – and consumers are more likely to start their holiday shopping early this year. To get you ready for the 2022 holiday shopping season, we looked back at consumer shopping trends from 2019-2021. What did we learn and what trends do we expect to see this year? Let’s look back. A look back Over the last three years, average consumer spending has increased. Record 2021 holiday sales came amidst a wave of COVID-19 cases, rising inflation, labor shortages, and supply chain problems. Despite these challenges, consumers continued to let it snow when it came to spending during the holiday season. 2022 has been a year with its own economic roadblocks – the war in Ukraine, rising gas prices, and recession concerns. Yet 2021 was a banner year for holiday sales despite its obstacles, and we predict similar trends in the 2022 holiday shopping season. What trends do we expect to see for the most wonderful time of the year? 2022 predictions While consumer spending remains strong, changing economic conditions continue to shape shopper behavior. To develop our predictions for 2022 holiday shopper behavior, we focused on four key areas: When consumers shop Where consumers shop What consumers purchase Consumer media preferences Now, let's make our holiday campaign planning checklist and check it twice. When consumers shop Chestnuts roasting on an open fire. Jack Frost nipping at your nose. Those aren’t the only ways to know when the holiday season has begun. Shoppers tend to spread out their holiday purchases across multiple months and were more likely to start shopping earlier. To understand holiday retail sales trends from 2019-2021, we identified four shopper segments: Early Shoppers Traditional Shoppers Late Shoppers Random Shoppers What differences did we see between our four shopper segments? Early shoppers made almost half of their holiday purchases in October Random shoppers spread out their holiday purchases evenly across multiple months Late shoppers made almost half of their holiday purchases in December Traditional shoppers made almost half of their holiday purchases in November While December continues to dominate holiday sales, October has started to gain traction over the last three years, and November remains a core shopping month. Everybody knows a turkey and a mistletoe help to make the season bright but knowing when your consumers are most likely to shop will help deck your campaign planning halls. Jingle bell rock your way to holiday sales that shine bright with our tips to prepare for earlier shoppers: Offer targeted promotions earlier in the shopping season Target your ads based on the shopping habits of your customers throughout the season Where consumers shop There’s no place like home for the holidays but most consumers aren’t shopping from home. Despite the rise in online shopping, brick and mortar locations continue to dominate holiday sales. October is the most popular month to take a one-horse open sleigh to a store, and consumers gather around the fire to online shop in November and December. With most shoppers preferring to shop in-store, and e-commerce popularity growing, it’s critical to think about bridging the gap between your online and offline presence for the consumer. Are you offering multiple paths to purchase with solutions such as BOPIS (Buy Online, Pickup In-Store)? Go down in history like Rudolph with our tips to prepare for more in-store shopping: Focus on in-store shopping experience technology (self-checkout, VR, QR codes, scan to pay, etc.) Offer multiple paths to purchase to connect your online and physical presence through methods such as BOPIS (Buy Online, Pickup In-Store), BORIS (Buy Online, Return In-Store), and ROPO (Research Online, Purchase Offline), etc. What consumers purchase When it comes to holiday gifts, for some, only a hippopotamus will do. Compared to pre-pandemic, shoppers are spending more at apparel stores and mass retailers. Spending at specialty retailers, warehouse clubs, and on office, electronic, and games is almost the same across holiday and non-holiday shopping months. Time for toys and time for cheer may be year-round, but are there any correlations between where consumers shop (online vs. in-store) and what they purchase? Our data found that shoppers who bought from mass retailers were more likely to shop online, while shopping for apparel and warehouse clubs was done at a physical store location. Put this insight to the test by thinking through how you can target your consumer based on where they shop in-store and online. You just might find that hippopotamus at a brick and mortar mass retailer location! Consumer media preferences Do you see what I see? While we are seeing a shift to digital media channel preference, consumers still engage with traditional media channels like direct mail and the traditional newspaper. Successfully connecting with your customers involves capturing their attention through the right channel. We found that our four shopping groups prefer a mix of traditional and digital media channels. What does your media channel mix look like? Hark! The herald angels sing of ways to adapt to the change in holiday spend and media preferences: Align your activation efforts to digital, but don't forget about traditional channels Expand your targeting and activation focus beyond in-store vs. online Download our new 2024 report For a deeper dive into our predictions and actionable insights you can use to take your holiday campaign planning home for the holidays, download our new 2024 report. Experian data can help you refine your content and creative strategy to achieve maximum ROI for each campaign across all your channels. Download now

Fluctuation in consumers' behaviors and preferences during the pandemic has prompted a shift in the practices and patterns that we are accustomed to. Powerful market forces are emerging as society builds a new normal, forcing marketers to rethink their strategy, activation, and measurement. It is important for marketers to understand the forces that influence the industry, and to learn about alternative approaches that can be applied to help reach their goals. In our recent webinar, ‘How to Adjust to the New World of Advertising,’ Experian’s Chris Feo and guest speaker Tina Moffett, Principal Analyst at Forrester Research, lead an in-depth discussion of the market dynamics and developments guiding us to this new era of advertising. They talked about: The pandemic changing consumer behavior Emerging media channels Data deprecation The pandemic and increased media consumption The pandemic caused seismic shifts in consumer behaviors and business operations. Work from home became the norm, consumers made drastic changes in their routines, and businesses had to adjust to new operating models as local economies shrank and supply chains strained. As stay-at-home orders were put into effect, consumers increased their media consumption drastically as more time was spent at home in front of their devices. According to Forrester, by June 2020, 48% of US online adults subscribed to at least one streaming service, while 34% had signed up for multiple. Forrester contends that: Social and online video/OTT will grow fastest among other categories of ad spend Connected TV outpaces other video advertising channels 55% of consumers plan to continue watching movies at home rather than in theatres after the pandemic Data deprecation The ways that marketers can personalize content and measure the effectiveness of campaigns is changing with data deprecation. Consumer preferences, regulations, and technology providers are evolving the way advertisers understand consumers, causing changes to existing identity-based marketing strategies. According to Forrester, 66% of marketers are investing in first-party data collection strategies to adapt to these market forces. Marketers need to adjust Demand for a new advertising approach Changes in consumer behavior, evolving media consumption patterns, and data deprecation have marketers looking at new approaches to targeting and measurement. However, with the future uncertain in many of these areas, marketers need to test and experiment to determine which approach is best for them in particular use cases. Shifting to a new world of experimentation Advertisers need to start by assessing their current environment to determine where they have exposure today, which methods of identification they are using, and how those channels may be impacted by the market forces outlined earlier. From there, they need to start asking themselves how they can assess identity in the future or if there is another way to approach advertising in that specific channel. There are specific areas where marketers can look to make investments in terms of experimentation: Adoption of cleanrooms to support analytics and audience targeting Investment in first-party data to overcome the issue of data deprecation Shifting to a value-based, omni-channel advertising mindset to address customers’ needs Investment in data-savvy resources to manage media insights Adoption of consistent cross-platform advertising metrics and currencies to inform better planning If you missed our recent webinar ‘How to Adjust to the New World of Advertising,’ you can listen to the full discussion here.