
Agencies, platforms, and marketers stand at the crossroads of transformation, as privacy regulations tighten, technology accelerates, and consumer behaviors evolve. Yet these challenges also present extraordinary opportunities.
Our 2025 Digital trends and predictions report highlights five trends that will shape 2025 and digs into:
- What’s changing in the market
- How to keep learning about your customers
- How to reach your customers in different places
- How to measure what’s really working along the way
In this blog post, we’ll give you a sneak peek of three of these trends — from cracking the code of signal loss to tapping into the buzz around connected TV (CTV) and stepping up your omnichannel game. Think of it as a taste test before the main course. Ready for the full menu? Download our report to get the lowdown on all five trends.
1. Signal loss: A rich appetizer of alternate ingredients
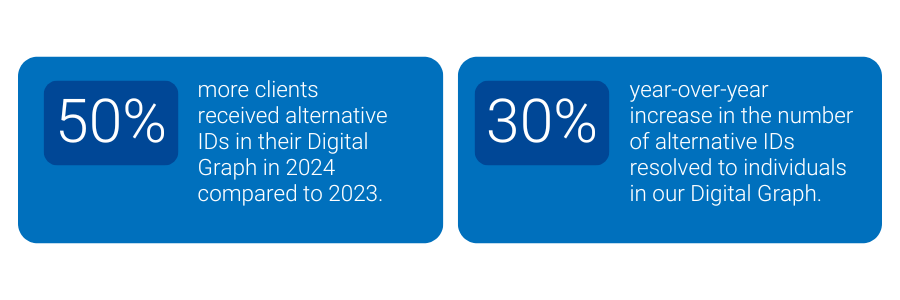
As traditional cookies crumble, marketers need fresh ingredients to keep the flavor coming. Already, about 40% of browser traffic doesn’t support third-party cookies, and marketers are spicing things up with first-party data, alternative identifiers like Unified I.D. 2.0 (UID2) and ID5, and contextual targeting strategies. In fact, 50% more of our clients received alternative IDs (UID2, ID5, Hadron ID) in their Digital Graph in 2024 compared to 2023. The number of alternative IDs resolved to individuals in our Digital Graph increased by 30% year-over-year – as everyone looks beyond the cookie jar.
There is no secret sauce to replace cookies. Instead, expect a multi-ID recipe that brings together different identifiers, unified by an identity graph. This approach turns a fragmented pantry of data into a cohesive meal, giving you a complete view of your customer on every plate.
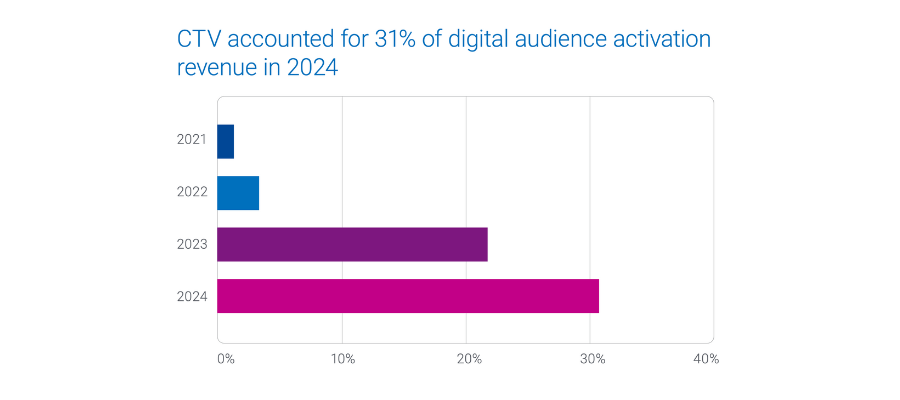
2. The rising power of CTV: A hearty entrée of opportunities
CTV is quickly becoming the main dish on the streaming menu, as viewers load up on their favorite shows. While CTV is slated to make up 20% of daily U.S. media consumption by 2026, advertisers are still holding back on pouring in the ad spend. To unlock its full flavor, marketers need to whip up solutions like frequency capping and unified audience activation.
Although CTV will account for 20% of daily U.S. media consumption by 2026, it’s projected to command only 8.1% of ad spend. Frequency capping and unified audience activation solutions will be key to unlocking CTV’s full potential.
By 2025, nearly half of CTV “diners” will choose free ad-supported streaming TV (FAST). Marketers need strategies to prevent ad overexposure. With 50% of U.S. consumers avoiding products due to ad overload, and 30% of marketers willing to increase their CTV spend if frequency capping improves, unified identity solutions help ensure every impression is served just right.
3. Omnichannel: A flavorful fusion plate
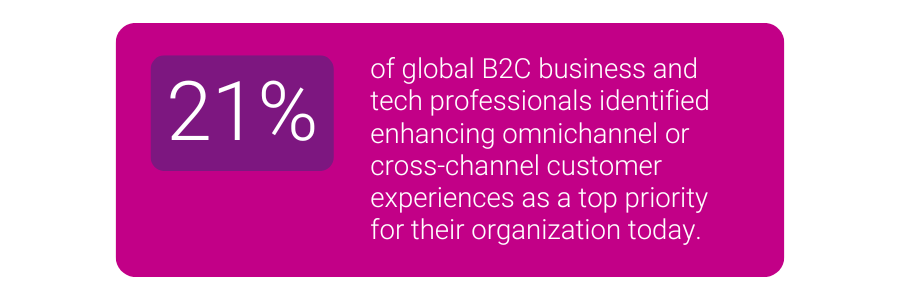
No one likes a one-flavor meal. Marketers are moving beyond single-channel “side dishes” to omnichannel “fusion feasts” that blend direct mail, digital, CTV, and retail media networks (RMNs) into a truly cohesive culinary experience. Even though only 21% of global B2C professionals currently put omnichannel at the top of their shopping list, the growing demand for seamless, audience-first campaigns is heating up.
In 2025, having an audience-first approach will be like having a perfect pairing for every course. Unified identity solutions act as your master sommelier, ensuring that each channel complements the next, and every customer enjoys a well-rounded, memorable journey.
Vertical trends: A dessert sampler from four unique kitchens
Different markets have their own signature flavors.
- In Auto, crossover utility vehicles (CUVs) claim 51% of new vehicle registrations, and consumers in the 35-54 age group and families are the primary buyers. Automotive marketers should prioritize CUV advertising with a strong focus on family-oriented and income-appropriate messaging
- In Financial Services, marketers need to anticipate shifts in consumer behavior tied to economic conditions, such as increasing demand for deposit products when interest rates are high. For insurance, aligning campaigns with life events, like new home purchases or marriage, can maximize engagement.
- In Healthcare, advertisers are prioritizing personalized, regulation-compliant campaigns that address social determinants of health (SDOH).
- In Retail, advertisers are increasingly activating on both CTV and social platforms, with many managing their own in-house campaigns. While larger brands often rely on media agencies, a shift toward in-house media buying is emerging among some bigger players, offering more control over audience targeting and performance metrics.
Our report covers each vertical’s unique menu, helping you select the right “ingredients” for your customers. With the top Experian Audiences on hand, you can create feasts that delight, nourish, and convert.
Hungry for more? Download our full menu
The three “samples” you’ve just tasted are just the starters. Our 2025 Digital trends and predictions report serves up five insights, complete with strategies, data, and tools to help you adapt, scale, and thrive in 2025.
Ready for the full menu? Download our report now and discover all five trends that will shape your marketing “cookbook” in 2025. Bon appétit!
Latest posts

Learn what deliverability really means in email marketing and how to ensure your customers actually receive your emails.

Top 5 marketing resolutions to improve your marketing programs. Learn the most effective way for better customer engagement.

Dextro clients to achieve increased accuracy in cross-device consumer measurement and engagement NEW YORK, Feb. 6, 2017 /PRNewswire/ — Dextro Analytics, a pure play analytics company that harnesses the power of human learning and artificial reasoning to drive more informed and effective consumer marketing, is partnering with Tapad, the leading provider of unified, cross-screen marketing technology solutions and now a part of Experian. The deal is effective immediately and the scope of the partnership covers North America. Additional terms were not disclosed. Leveraging Tapad's privacy-safe Device Graph™, Dextro Analytics will be able to significantly bolster its insight engine to decode complex customer journeys. Armed with more relevant, actionable insights, marketers can use Dextro's cross-screen, closed-loop measurement systems to reach and engage the right customer at the right time through the right channel. "Being able to accurately map consumer preferences, behaviors and journeys in a privacy-safe and unified way across devices is still one of the biggest pain points for marketers," said Ajith Govind, co-founder of Dextro Analytics. "At the same time, this partnership engages customers with the right message at the right time." "Detecting latent patterns and signals, and tracing backward- and forward-looking behavioral characteristics, are keys to sustaining a competitive advantage in a crowded space," said Manmit Shrimali, co-founder of Dextro Analytics. "With the proliferation of data and devices, connecting the dots is of paramount importance." "Dextro is solving some of the biggest challenges in analytics today," said Pierre Martensson, GM of Tapad's data division. "Our partners consistently see notable improvements in both budget allocation and device optimizations after integrating with the Tapad Device Graph, and I have every confidence that Dextro will be among them." For more information about Dextro Analytics' revolutionary approach to using human learning and artificial intelligence algorithms to solve business and analytical problems, please visit http://dextroanalytics.com/. For more information about Tapad's cross-platform advertising solutions, please visit https://www.experian.com/marketing/consumer-sync Contact us today!