
Experian, the leader in powering data-driven advertising through connectivity, is thrilled to unveil our latest solution, Digital Graph and Marketing Attributes. This joint solution supplies marketers and platforms with the insights and connectivity needed to understand who their customers are and reach them across digital channels.
The uncertainty around third-party cookies in Chrome and the overall decline in signal complicates the industry’s ability to reach the right consumer. Omnichannel media consumption results in scattered data, making it harder for marketers and platforms to understand consumer behavior and reach them across channels. These challenges call for a comprehensive solution.
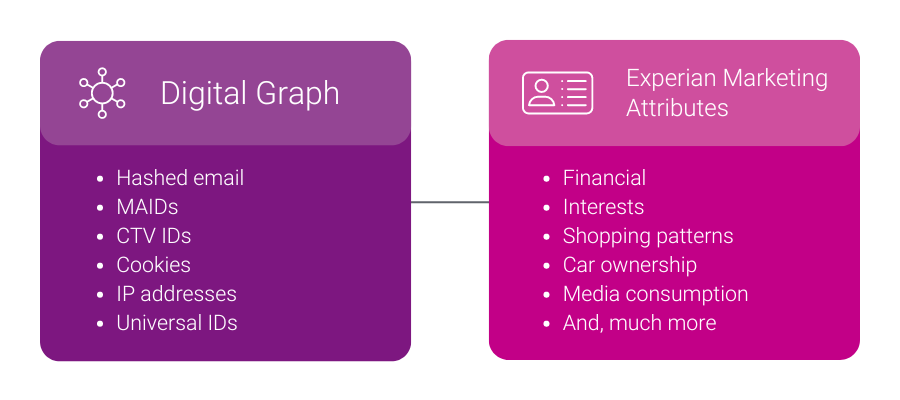
Our Digital Graph and Marketing Attributes solution addresses these challenges by providing identifiers for seamless cross-channel engagement. By adding Marketing Attributes, like demographic and behavioral data, marketers and platforms also gain a better understanding of their customers. This solution uses Experian’s Living Unit ID (LUID) to combine offline and digital data, giving customers deeper insights into consumer behavior, greater audience reach, and improved cross-channel visibility.
Benefits of Digital Graph and Marketing Attributes
Both our Digital Graph and Marketing Attributes provide value to clients as standalone products. When clients license our Digital Graph and Marketing Attributes joint solution, they have more data at their fingertips, unlocking:
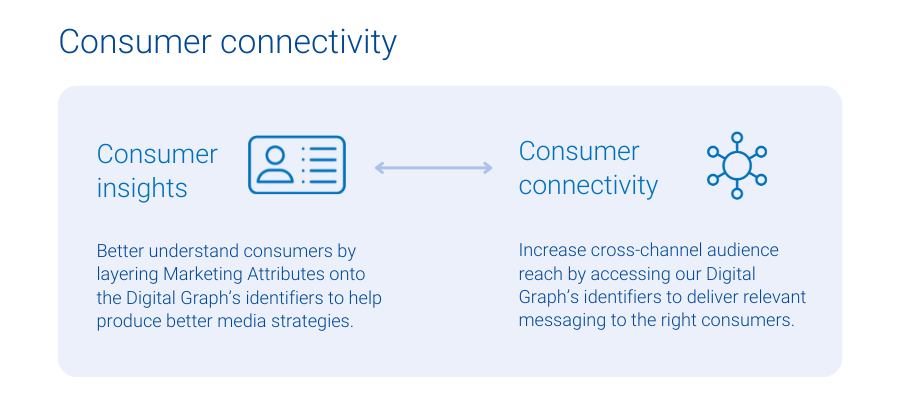
- Consumer connectivity: When clients license Experian’s Digital Graph, they get access to digital identifiers like mobile ad IDs (MAIDs), connected TV (CTV) IDs, hashed emails (HEMs), and universal IDs so they can target the right consumers with the relevant messages across all digital media channels.
- Consumer insights: Experian’s 5,000 Marketing Attributes provide our clients with detailed consumer information and insights, such as age, gender, purchase behaviors, and content consumption habits. Marketing Attributes help clients create more relevant messaging and informed audience segmentation.
Client examples
How OpenX offers richer targeting and more connectivity with Experian
OpenX is an independent omni-channel supply-side platform (SSP) and a global leader in audience, data, and identity-targeting. With industry-leading technology, exceptional client service, and extensive scalability across all formats, including CTV, app, mobile web, and desktop, OpenX has a legacy of innovating products that enhance buyer outcomes and publisher revenue while addressing complex challenges in programmatic.
In recent years, OpenX has licensed Experian’s Digital Graph with identifiers, contributing to the SSP’s largest independent supply-side identity graph, which offers advanced audiences to buyers and improved data resolution to content owners.
More recently, OpenX licensed Experian’s Marketing Attributes to enrich its supply-side identity graph, which includes IPs, MAIDs, and client IDs, with a variety of attributes. This strategic move has helped OpenX’s clients benefit from enhanced consumer insights and addressability, in turn delivering greater reach to the demand side and higher revenue for publishers, despite industry signal loss.
“We built on our long-term partnership with Experian to enrich our digital IDs with Experian’s Marketing Attributes, which help provide buyers better insights to audiences, thereby helping our publishers monetize their inventory. With partners like Experian, OpenX effectively facilitates the value exchange between demand and supply, ensuring our partners are able to drive results for their business in the era of signal loss”
Craig Golaszewski, Sr. Director of Strategic Partnerships, OpenX
How StackAdapt licenses our product bundle to address three different use cases
StackAdapt is the multi-channel programmatic advertising platform trusted by marketers to deliver exceptional campaigns. They drive superior results through a variety of solutions, like contextual and first-party targeting, brand lift measurement, and optimization through insights.
StackAdapt licensed a similar yet unique product combination, our Digital Graph and our Audiences. StackAdapt uses the Digital Graph to allow clients to onboard their first-party data in a seamless, self-serve manner that allows them to further segment their data using Experian Audiences.
“StackAdapt has been recognized as the most trusted programmatic platform by marketers, and with the integration of Experian’s Digital Graph and Audiences, we are strengthening our leadership in the space. This partnership improves our ability to deliver precise cross-channel segmentation, reach, and measurement, helping advertisers run more successful campaigns. Our collaboration with Experian allows us to offer a differentiated solution in the market and ensure our clients can deliver the most precise and impactful ads to their audiences.”
Denis Loboda, Senior Director of Data, StackAdapt
We recently announced a new partnership with StackAdapt. This collaboration brings the power of Experian’s identity graph, syndicated and custom audiences directly to the StackAdapt platform. Read the full details in our press release here.
Four ways to use Digital Graph and Marketing Attributes
When these two products come together, our clients have a 360-degree view of their consumers, which helps them power four critical use cases:
- Analytics and insights: Learn more about your consumers by connecting our Marketing Attributes with our Digital Graph’s identifiers. For example, a retailer can discover that their recent customers over-index as pickleball fans and players, leading the retailer to sponsor a professional pickleball event.
- Inventory monetization: When supply-side partners know their audience better, they can attract advertisers in search of that audience. For example, a publisher might find out that their audience is full of pickleball fans, leading them to reach out to brands that want to reach this audience.
- Activation: Companies with access to more digital identifiers from our Digital Graph can reach more people, while controlling frequency across channels. A company might know that they want to reach pickleball fans. Now, they have the digital identifiers needed to reach pickleball fans across all digital channels where they consume content, leading to increased reach.
- Measurement and attribution: Use the Digital Graph’s support for various digital identifiers to understand all consumer touchpoints, from media impressions to conversions. Then, lean on our Marketing Attributes to determine who your messaging resonated with. For example, a company uses our Digital Graph to know if it was the same individual who was exposed to an ad on CTV and converted via e-commerce. On top of that, the company can use our Marketing Attributes data to find out that the people who purchased were overwhelmingly pickleball fans.
Connect with us to learn more about how our Digital Graph and Marketing Attributes joint solution can provide the data and insights you need to create, activate, and measure cross-channel media campaigns.
Latest posts

Cross-Screen Pioneer Explores the Power of Connected Cars as a Vehicle for Customer Engagement LAS VEGAS, NV — (October 26, 2016) –Kate O’Loughlin, GM of Media for Tapad, addressed the J.D. Power Automotive conference audience today in Las Vegas, NV. With more than 1,400 participants representing every facet of the automotive marketing profession, the conference has become the industry's leading marketing event. Bringing the unified, cross-screen perspective to the stage, O’Loughlin discussed the vital role of connected cars in the consumer engagement process. She is a founding member of Tapad which launched the world’s first cross-screen marketing technology in 2010. Tapad was acquired by the Telenor Group early in 2016. Key points from O’Loughlin’s J.D. Power 2016 address included: The marketers who deliver relevant and engaging content in a privacy-safe setting will be in the strongest position to navigate the proliferation of connected devices, including the connected points in cars. As automakers innovate the technology in cars, marketers need to be prepared for the size and diversity of data available for understanding consumers. It’s going to be increasingly difficult to wade through the data, so now is the time to build a solid framework for understanding the person behind the data. Marketers who evolve — and take a holistic approach — to their campaign measurements will achieve marked improvements in efficiency and an enhanced understanding of their core audiences. Actionable brand engagement metrics like Viewable Exposure Time (VET) will continue to overtake traditional advertising performance metrics. VET evaluates the optimal amount of time an ad is present on a screen to incite consumer action. In early testing by Tapad, campaigns that employ VET see conversion rate performance improvements from 13 to 60%. The consumer-centric technology solutions of the future need to be as scalable as they are affordable. Learn more about Tapads’ recommended Viewable Exposure Time metric contact us today! Contact us
NEW YORK, Sept. 28, 2016 /PRNewswire/ — Tapad, the leader in cross-device marketing technology, today announced a new metric for cross-device marketers, Viewable Exposure Time (VET). Viewable Exposure Time measures across screens and ad formats, identifying the optimal amount of time a consumer spends with an ad before they take action. The announcement coincides with Unify Tech '16, Tapad's third-annual cross-device summit during Advertising Week NY. Frequency caps are currently used to ensure that dollars aren't wasted on redundant ads. Viewable Exposure Time evolves the frequency capping approach to include accelerating a consumer's ad exposure rate up to the optimal time spent with the brand. VET is used in affinity, digital transaction and offline purchase models as a key indicator of marketing budget well-spent. Beta users of VET span every vertical, though interest is especially high from CPG, Automotive, Telecommunications and Retail. Viewable Exposure Time unifies and upgrades marketers' predictors of advertising success by leveraging cross-screen engagement across digital and television, with vendor-agnostic viewability scores for video, rich media and display. "Today's current measurement options, like click-through rate (CTR) and TV gross ratings points (GRP) tell an incomplete story," said Tapad GM of Media Kate O'Loughlin. "Tapad is focused on measuring what really matters to marketers – building an efficient connection with a customer. Innovation in metrics was long overdue." More than just a measurement tool, Tapad also provides clients with VET activation. Factoring in time spent with ads in viewable seconds and minutes, these analytics inform marketers about which audiences are underexposed, enabling them to adjust campaigns and deliver according to optimal viewable exposure time. This effectively increases conversion rates at the lowest cost. Contact us today

Strong Revenue Performance and Thriving Culture Contribute to Industry Recognition NEW YORK, Sept. 15, 2016 /PRNewswire/ — Tapad, the leader in cross-device marketing technology and now a part of Experian, was named a top company on Inc. Magazine’s list of the 5000 fastest-growing private companies in the U.S. In addition, Tapad won the TMCnet 2016 Tech Culture Award. The exclusive Inc. 5000 ranking highlights the fastest-growing privately-held* companies in America. These distinguished companies have achieved success in strategy, service and innovation. TMCnet recognizes talented tech professionals who are committed to building a culture that prioritizes employee growth, collaboration and engagement. Tapad continues to broaden their presence into new markets, having launched in APAC earlier this year, as well as continuing their European expansion. Tapad’s proprietary technology, The Device Graph™ is leveraged by more marketers and brands to understand digital engagement across devices. The company’s rapidly expanding client base includes numerous Fortune 500 company brands as well as all four major advertising holding companies in the U.S. “We have an exceptional team of innovative people who are all working very hard to achieve the kind of results these publications are recognizing,” said Tapad CEO and Founder, Are Traasdahl. “Given that, we have an even greater responsibility to our talent to create an environment that fosters innovation and nurtures open communication. Ultimately, this is how we will continue to reach our very ambitious goals of becoming the world’s leading unified marketing technology provider.” Tapad’s award-winning work culture is defined by its gold-standard benefits which include a six-month parental leave policy, unlimited vacation time, company-sponsored meals and office space designed to facilitate collaboration and open communication. Tapad’s highly talented team has also received multiple customer service awards in 2016. These awards include the iMedia ASPY awards for Best Customer Service and Best Mobile Partner as well as recognition from The Communicator Awards of Excellence in Interactive Media. *Prior to Tapad’s acquisition by Telenor in February 2016. Contact us today!