Cuebiq’s mission, as an offline intelligence and measurement company, is to deliver the most accurate and reliable insights on how digital marketing efforts impact offline consumer behavior. This case study shows how Cuebiq, despite signal loss, partnered with Experian to continue delivering in-store lift analyses. To achieve this, Cuebiq used Experian’s Activity Feed to resolve digital ad exposures to in-store purchases, so that marketers could know the effectiveness of their clients’ media campaigns.
Activity Feed helped Cuebiq increase its match rates by using all the identifiers supported in Experian’s signal-agnostic Digital Graph, reducing its reliance on third-party cookies. By partnering with Experian, Cuebiq could help their clients, marketers, more accurately measure their campaigns and optimize their media.
What is Activity Feed?
Experian’s Activity Feed pulls together fragmented digital event data from all digital channels, including browsers like Safari and Firefox that restrict traditional tracking methods. Activity Feed ingests and ties this digital ad exposure data to household or individual profiles hourly, helping clients associate that data to offline purchase activity made by that household or individual. Activity Feed plays a crucial role in overcoming fragmented data and helping marketers accurately measure their cross-channel marketing efforts.
Challenge: Increasing match rates across digital platforms
Cuebiq wanted to enhance how well they connect digital ad exposures, across web, mobile and connected TV (CTV) to specific mobile ad IDs (MAIDs), of those who visited clients’ stores. They needed a single technology partner who could collect data across these environments and improve these connections, especially as iOS updates, like iOS 14.5, posed potential challenges.
With the ability to resolve exposures to households, individuals, and MAIDs to then facilitate attribution of digital exposures to offline store visitation, Cuebiq could continue to provide accurate reports on how online ads impact offline consumer behavior. This clarity in data enables their clients to fine-tune their marketing strategies.
Cuebiq’s key objectives included:
- Resolving digital exposures to MAIDs
- Increasing overlap of offline and online data
- Improving the effectiveness of offline measurement offerings
Activity Feed: The solution to increase match rates
Cuebiq used Activity Feed to resolve data from cookieless environments like Safari to a single household or individual and saw significantly higher match rates. Cuebiq was able to track cross-channel media exposures, resolve them to MAIDs, and then use the Activity Feed output to correlate in-store visitation and sales to their clients’ media campaigns. Cuebiq also implemented the Experian pixel, which they placed to track all their marketers’ impressions (mobile, CTV, web traffic, etc.). The Experian pixel collects information in real-time, such as:
- Timestamp
- Cookies
- Device ID (MAID/CTV) when available
- IP address
- User-Agent
- Impression ID
“Before we started working with Experian, we couldn’t fully maximize ad views across the complex digital landscape. In just a few weeks, they were able to maximize the match rate across the fragmented digital inventory, solving a huge problem when it comes to cross-channel attribution.”
Luca Bocchiardi, Director of Product, Cuebiq
Results
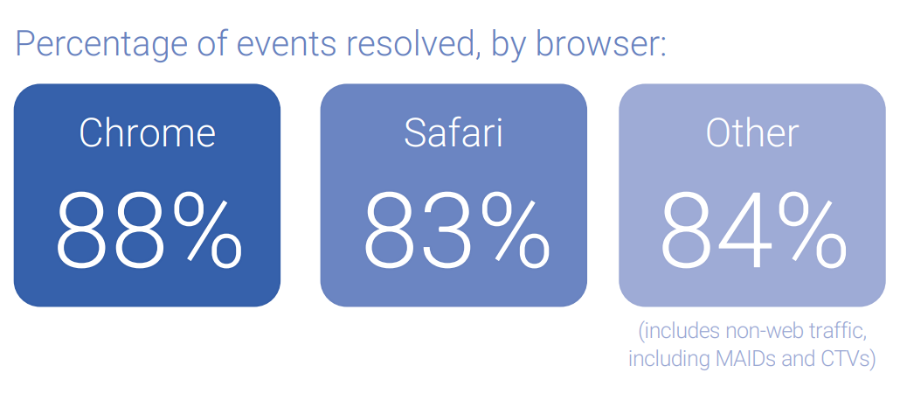
Activity Feed combines separate data streams and matches them back to a household. This enables Cuebiq to expand household IDs and accurately identify MAIDs that are seen in-store for cross-channel measurement. Over a 21-day period, Cuebiq passed ~1 billion events to Experian. Activity Feed resolved 85% of total events to a household, 91% of which were tied to MAIDs.
By implementing Activity Feed, Cuebiq was successfully able to:
- Gain clearer insights into the success of their client‘s campaigns
- Match consumer engagements in a privacy-compliant manner
- Tell the story of the key performance indicators (KPIs) related to their marketing efforts
Prepare for a cookieless future with higher match rates
Activity Feed is prepared for a cookieless future and uses alternative IDs, like ID5 IDs, hashed emails, and IPs for identity resolution, ensuring no reliance on third-party cookies. Experian remains fully committed to exploring a suite of next-generation solutions and prioritizing continued testing of different industry solutions, including the Google Privacy Sandbox, to help customers prepare for a future without cookies. We’ve identified six viable alternatives to third-party cookies, how these alternatives fall short, and how Experian can help you navigate these alternatives.
“Experian’s customer service is extremely efficient and collaborative. We trust them to keep putting our business first long-term.”
Luca Bocchiardi, Director of Product, Cuebiq
Download the full case study to discover how Cuebiq used Activity Feed to overcome their challenges. Your path to maximizing match rates and resolving data from cookieless environments starts here.
About Cuebiq
Cuebiq is transforming the way businesses interact with mobility data to providing a high-quality and transparent currency to map and measure offline behavior. They are at the forefront of all industry privacy standards, establishing an industry-leading data collection framework, and making it safe and easy for businesses to use location data for innovation and growth.
To learn more, visit their website at www.cuebiq.com
Latest posts

New data from Experian Marketing Services’ Simmons® ConnectSM mobile and digital panel sheds light on the way smartphone users spend time using their phone, with the average adult clocking 58 minutes daily on their device. On average, smartphone owners devote 26% of the time they spend on their phone talking and another 20% texting. Social networking eats up 16% of smartphone time while browsing the mobile web accounts for 14% of time spent. Emailing and playing games account for roughly 9% and 8% of daily smartphone time, respectively, while use of the phone’s camera and GPS each take up another 2% of our smartphone day. *Activities include use of a smartphone’s native features dedicated to each activity as well as downloaded apps whose primary function falls under the given activity. For instance, “watch video” includes the act of watching video on the smartphone’s native video player as well as use of video apps such as YouTube, Netflix, etc. iPhone versus Android users Smartphone users may constantly debate which operating system is supreme, but we see clear differences between the ways consumers use their phone depending on the operating system that runs it. For starters, iPhone users spend an hour and fifteen minutes using their phones per day, a full 26 minutes more than the typical Android phone owner. Additionally, iPhone and Android smartphone owners use their phones in markedly different ways. For instance, 28% of the time that Android users spend using their phones is dedicated to talking, whereas iPhone users spend only 22% of their smartphone time talking on the device. Android owners also devote a greater share of time visiting websites on their phone than iPhone owners. On the other hand, iPhone owners spend a disproportionately greater share of smartphone time than Android owners texting, emailing, using the camera and social networking. Note on time spent It may surprise some to read that an activity like watching video accounts for such a small share (less than 1%) of the typical adult’s daily smartphone use. However, for the charts above to sum to a single daily total it was necessary to calculate individual activity contribution using a base of all smartphone owners, including those who don’t spend any time engaging in a given activity during a typical day. The chart below provides additional insights into the time spent engaging in the major smartphone activities examining only those individuals who engaged in each activity during a 24-hour period. I’ve also added into the chart a reach and frequency metric to indicate the popularity of each activity and the number of times per day that individuals engage in them. In the chart, the activities with the largest bubbles are those in which the greatest share of smartphone owners engage during a typical day and include the usual suspects: talking (79%), texting (76%), visiting websites (62%), emailing (61%) and social networking (52%). Activities with the fewest daily participants are: watching video, which 2.3% of smartphone owners do during a typical day, and reading, which just 0.5% of smartphone owners do daily. Given that nearly 98% of smartphone users don’t watch videos on their phone during a typical day, it’s easier to understand why video comprises such a low share of the average adult’s daily smartphone use. However, the chart above reveals that those who do watch video on their phone spend, on average, 5 minutes a day watching videos spread out over 4.2 different viewing sessions. For more information on consumers’ usage of smartphones, digital tablets, computers and other traditional and digital media platforms, check out Simmons Connect.
New health information exchanges are prompting data quality efforts, as state and local healthcare agencies look to electronically share patient data.
If the time spent on the Internet for personal computers was distilled into an hour then 27 percent of it would be spent on social networking and forums across the United States, United Kingdom and Australia. In the U.S., 16 minutes out of every hour online is spent on social networking and forums, nine minutes on entertainment sites and five minutes shopping. Global comparison In the UK, 13 minutes out of every hour online is spent on social networking and forums, nine minutes on entertainment sites and six minutes shopping. Australian Internet users spend 14 minutes on social sites, nine on entertainment and four minutes shopping online. Across all three markets, time spent shopping online grew year-over-year, but the UK market emerged as having the most prolific online shoppers, spending proportionally more time on retail Websites than online users in the U.S. or Australia. British Internet users spent 10 percent of all time online shopping in 2012, compared to nine percent in the U.S. and six percent in Australia. This was in part due to a bumper winter holiday season in the UK where 370 million hours were spent shopping online, 24 percent higher than the monthly average. Consumption of news content also increased across all three markets with Australian users emerging as the most voracious consumers of news online. Six percent of all time spent online in Australia in 2012 was on a news Website, compared to five percent in the UK and four percent in the U.S. Meanwhile, the time spent on social media proportionate to other online activities declined across all three regions. The U.S., which has been the most dominant market for social media consumption in the last three years dropped from 30 percent of all time spent online to 27 percent. In Australia time spent on social dropped from 27 percent to 24 percent while in the UK it dipped from 25 percent to 22 percent year-over-year. This highlights the rise in access via 3G and 4G networks as consumers spend increasingly more time online while on the move. "Understanding consumer behavior across channels is more important than ever as more visits are being made on the move, particularly among social networking and email,” says Bill Tancer, general manager of global research for Experian Marketing Services. "With smartphones and tablets becoming more powerful, our data clearly indicates the difference between mobile and traditional desktop usage further enabling the ‘always on’ consumer mentality. Marketers need to understand these differences, as well as regionally, to ensure campaigns can be tailored for better and more effective engagement.” Mobile browsing When looking at the U.S. browsing data for mobile devices, email accounted for the largest time spent on average, for the same categories for Q1 2013. Email made up 23 percent of time spent on mobile devices for Q1-13, while social networking accounted for 15 percent. Entertainment had the third highest time spent with 13 percent, followed by shopping with 11 percent and travel with 9 percent. The mobile data does not include app usage, but does include mobile browsing within an app. Read more of the latest consumer trends in The 2013 Digital Marketer Report Learn more about consumer online behavior by visiting our Online Trends page Learn more about the author, Matt Tatham