Cuebiq’s mission, as an offline intelligence and measurement company, is to deliver the most accurate and reliable insights on how digital marketing efforts impact offline consumer behavior. This case study shows how Cuebiq, despite signal loss, partnered with Experian to continue delivering in-store lift analyses. To achieve this, Cuebiq used Experian’s Activity Feed to resolve digital ad exposures to in-store purchases, so that marketers could know the effectiveness of their clients’ media campaigns.
Activity Feed helped Cuebiq increase its match rates by using all the identifiers supported in Experian’s signal-agnostic Digital Graph, reducing its reliance on third-party cookies. By partnering with Experian, Cuebiq could help their clients, marketers, more accurately measure their campaigns and optimize their media.
What is Activity Feed?
Experian’s Activity Feed pulls together fragmented digital event data from all digital channels, including browsers like Safari and Firefox that restrict traditional tracking methods. Activity Feed ingests and ties this digital ad exposure data to household or individual profiles hourly, helping clients associate that data to offline purchase activity made by that household or individual. Activity Feed plays a crucial role in overcoming fragmented data and helping marketers accurately measure their cross-channel marketing efforts.
Challenge: Increasing match rates across digital platforms
Cuebiq wanted to enhance how well they connect digital ad exposures, across web, mobile and connected TV (CTV) to specific mobile ad IDs (MAIDs), of those who visited clients’ stores. They needed a single technology partner who could collect data across these environments and improve these connections, especially as iOS updates, like iOS 14.5, posed potential challenges.
With the ability to resolve exposures to households, individuals, and MAIDs to then facilitate attribution of digital exposures to offline store visitation, Cuebiq could continue to provide accurate reports on how online ads impact offline consumer behavior. This clarity in data enables their clients to fine-tune their marketing strategies.
Cuebiq’s key objectives included:
- Resolving digital exposures to MAIDs
- Increasing overlap of offline and online data
- Improving the effectiveness of offline measurement offerings
Activity Feed: The solution to increase match rates
Cuebiq used Activity Feed to resolve data from cookieless environments like Safari to a single household or individual and saw significantly higher match rates. Cuebiq was able to track cross-channel media exposures, resolve them to MAIDs, and then use the Activity Feed output to correlate in-store visitation and sales to their clients’ media campaigns. Cuebiq also implemented the Experian pixel, which they placed to track all their marketers’ impressions (mobile, CTV, web traffic, etc.). The Experian pixel collects information in real-time, such as:
- Timestamp
- Cookies
- Device ID (MAID/CTV) when available
- IP address
- User-Agent
- Impression ID
“Before we started working with Experian, we couldn’t fully maximize ad views across the complex digital landscape. In just a few weeks, they were able to maximize the match rate across the fragmented digital inventory, solving a huge problem when it comes to cross-channel attribution.”
Luca Bocchiardi, Director of Product, Cuebiq
Results
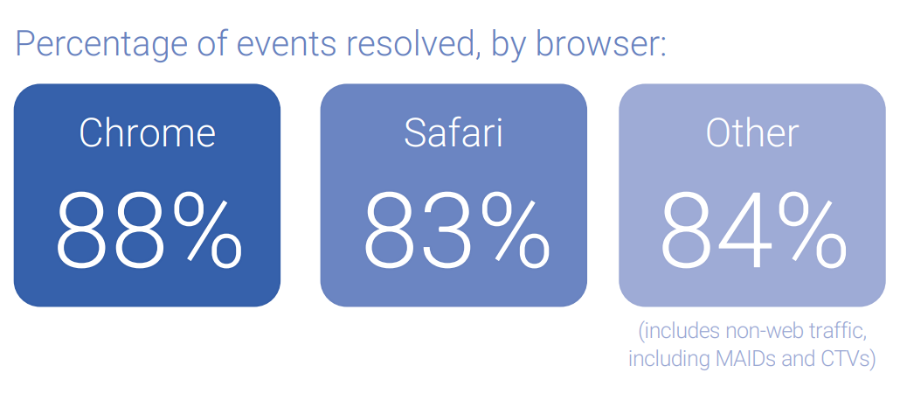
Activity Feed combines separate data streams and matches them back to a household. This enables Cuebiq to expand household IDs and accurately identify MAIDs that are seen in-store for cross-channel measurement. Over a 21-day period, Cuebiq passed ~1 billion events to Experian. Activity Feed resolved 85% of total events to a household, 91% of which were tied to MAIDs.
By implementing Activity Feed, Cuebiq was successfully able to:
- Gain clearer insights into the success of their client‘s campaigns
- Match consumer engagements in a privacy-compliant manner
- Tell the story of the key performance indicators (KPIs) related to their marketing efforts
Prepare for a cookieless future with higher match rates
Activity Feed is prepared for a cookieless future and uses alternative IDs, like ID5 IDs, hashed emails, and IPs for identity resolution, ensuring no reliance on third-party cookies. Experian remains fully committed to exploring a suite of next-generation solutions and prioritizing continued testing of different industry solutions, including the Google Privacy Sandbox, to help customers prepare for a future without cookies. We’ve identified six viable alternatives to third-party cookies, how these alternatives fall short, and how Experian can help you navigate these alternatives.
“Experian’s customer service is extremely efficient and collaborative. We trust them to keep putting our business first long-term.”
Luca Bocchiardi, Director of Product, Cuebiq
Download the full case study to discover how Cuebiq used Activity Feed to overcome their challenges. Your path to maximizing match rates and resolving data from cookieless environments starts here.
About Cuebiq
Cuebiq is transforming the way businesses interact with mobility data to providing a high-quality and transparent currency to map and measure offline behavior. They are at the forefront of all industry privacy standards, establishing an industry-leading data collection framework, and making it safe and easy for businesses to use location data for innovation and growth.
To learn more, visit their website at www.cuebiq.com
Latest posts

Cell phone ownership among American adults is 91% and 98% among young adults. Verizon and AT&T will almost certainly continue to dominate the market, especially given the fact that cell phone subscribers are increasingly staying with their provider for an extended period of time.
The popularity of flash sale websites with limited time & inventory offerings have grown exponentially over the two years. Online shoppers’ love for the thrill of snagging designer clothing, home décor, travel and even wine have caused visits to the category to increase 368% in July 2011 as compared to the same month two years ago and 109% one year ago. So far in 2011, Nordstrom acquired HauteLook, Amazon entered the fray with MyHabit and recently Saks Fifth Avenue announced the launch of a dedicated flash sale website after offering sale events per week on Saks’ main website. In July 2011, Zulily.com, a website offering sales targeted for women and babies/kids, captured the highest market share of visits at 16%, followed by Ideeli and LivingSocial Escapes. Amazon’s MyHabit ranked 11th, out of the 87 websites in the custom category after only 2 months in operation. Several of the major players over the past six months, the total visits to Ideeli increased 42%, Gilt.com up 14% and Nordstrom’s Hautelook up 8% for July 2011 as compared to February 2011. Total visits for MyHabit jumped 128% for July 2011 as compared to May 2011 when the website launched. The audience for Flash Sales continues to be attractive, and willing to shop – over-indexing against the online population for household incomes over $100k and creditworthy VantageScores of A and B.
The most effective way to segment a back-to-school audience is to include basic data elements with a segmentation methodology that recognizes the lifestyle and behavioral differences among households containing school-aged children. Experian’s Mosaic lifestyle segmentation solution can provide key insights into this lucrative audience.