Cuebiq’s mission, as an offline intelligence and measurement company, is to deliver the most accurate and reliable insights on how digital marketing efforts impact offline consumer behavior. This case study shows how Cuebiq, despite signal loss, partnered with Experian to continue delivering in-store lift analyses. To achieve this, Cuebiq used Experian’s Activity Feed to resolve digital ad exposures to in-store purchases, so that marketers could know the effectiveness of their clients’ media campaigns.
Activity Feed helped Cuebiq increase its match rates by using all the identifiers supported in Experian’s signal-agnostic Digital Graph, reducing its reliance on third-party cookies. By partnering with Experian, Cuebiq could help their clients, marketers, more accurately measure their campaigns and optimize their media.
What is Activity Feed?
Experian’s Activity Feed pulls together fragmented digital event data from all digital channels, including browsers like Safari and Firefox that restrict traditional tracking methods. Activity Feed ingests and ties this digital ad exposure data to household or individual profiles hourly, helping clients associate that data to offline purchase activity made by that household or individual. Activity Feed plays a crucial role in overcoming fragmented data and helping marketers accurately measure their cross-channel marketing efforts.
Challenge: Increasing match rates across digital platforms
Cuebiq wanted to enhance how well they connect digital ad exposures, across web, mobile and connected TV (CTV) to specific mobile ad IDs (MAIDs), of those who visited clients’ stores. They needed a single technology partner who could collect data across these environments and improve these connections, especially as iOS updates, like iOS 14.5, posed potential challenges.
With the ability to resolve exposures to households, individuals, and MAIDs to then facilitate attribution of digital exposures to offline store visitation, Cuebiq could continue to provide accurate reports on how online ads impact offline consumer behavior. This clarity in data enables their clients to fine-tune their marketing strategies.
Cuebiq’s key objectives included:
- Resolving digital exposures to MAIDs
- Increasing overlap of offline and online data
- Improving the effectiveness of offline measurement offerings
Activity Feed: The solution to increase match rates
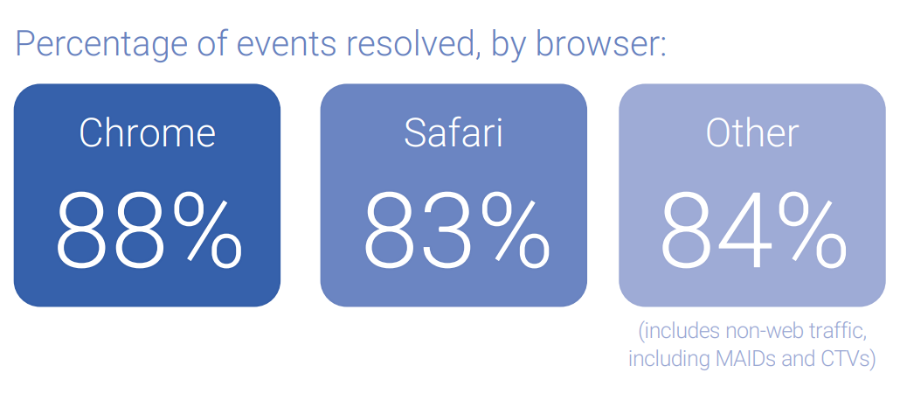
Cuebiq used Activity Feed to resolve data from cookieless environments like Safari to a single household or individual and saw significantly higher match rates. Cuebiq was able to track cross-channel media exposures, resolve them to MAIDs, and then use the Activity Feed output to correlate in-store visitation and sales to their clients’ media campaigns. Cuebiq also implemented the Experian pixel, which they placed to track all their marketers’ impressions (mobile, CTV, web traffic, etc.). The Experian pixel collects information in real-time, such as:
- Timestamp
- Cookies
- Device ID (MAID/CTV) when available
- IP address
- User-Agent
- Impression ID
“Before we started working with Experian, we couldn’t fully maximize ad views across the complex digital landscape. In just a few weeks, they were able to maximize the match rate across the fragmented digital inventory, solving a huge problem when it comes to cross-channel attribution.”
Luca Bocchiardi, Director of Product, Cuebiq
Results
Activity Feed combines separate data streams and matches them back to a household. This enables Cuebiq to expand household IDs and accurately identify MAIDs that are seen in-store for cross-channel measurement. Over a 21-day period, Cuebiq passed ~1 billion events to Experian. Activity Feed resolved 85% of total events to a household, 91% of which were tied to MAIDs.
By implementing Activity Feed, Cuebiq was successfully able to:
- Gain clearer insights into the success of their client‘s campaigns
- Match consumer engagements in a privacy-compliant manner
- Tell the story of the key performance indicators (KPIs) related to their marketing efforts
Prepare for a cookieless future with higher match rates
Activity Feed is prepared for a cookieless future and uses alternative IDs, like ID5 IDs, hashed emails, and IPs for identity resolution, ensuring no reliance on third-party cookies. Experian remains fully committed to exploring a suite of next-generation solutions and prioritizing continued testing of different industry solutions, including the Google Privacy Sandbox, to help customers prepare for a future without cookies. We’ve identified six viable alternatives to third-party cookies, how these alternatives fall short, and how Experian can help you navigate these alternatives.
“Experian’s customer service is extremely efficient and collaborative. We trust them to keep putting our business first long-term.”
Luca Bocchiardi, Director of Product, Cuebiq
Download the full case study to discover how Cuebiq used Activity Feed to overcome their challenges. Your path to maximizing match rates and resolving data from cookieless environments starts here.
About Cuebiq
Cuebiq is transforming the way businesses interact with mobility data to providing a high-quality and transparent currency to map and measure offline behavior. They are at the forefront of all industry privacy standards, establishing an industry-leading data collection framework, and making it safe and easy for businesses to use location data for innovation and growth.
To learn more, visit their website at www.cuebiq.com
Latest posts

As we ring in the New Year this week, Americans will be tossing back a few adult beverages in celebration. While alcohol consumption certainly increases around holidays and other times of celebration, many Americans imbibe year-round. So where across this great land of ours are you most likely to find adults willing and able to raise a glass (or two) and where are you most likely to be surrounded by teetotalers? Experian Simmons has the answer. Leveraging data from our SimmonsLOCAL study, we examined the drinking patterns of adults of legal drinking age in the 106 Designated Market Areas (DMAs) with populations of at least 500,000 adults age 21 and older. We then ranked those markets by the number of alcoholic beverages consumed by the average adult during a typical month. The chart below lists the DMAs that consume the most alcoholic beverages per capita in a typical month. First place goes to Boston, where the average adult of legal drinking age regularly kicks back 14.4 drinks a month. (Celebrations in Beantown are probably already underway.) Rank DMA Average drinks per month 1 Boston 14.4 2 Austin 13.8 3 Providence-New Bedford 13.4 4 Madison 13.2 4 Hartford & New Haven 13.2 6 Philadelphia 13.1 7 Chicago 13 8 Denver 12.9 9 Tallahassee-Thomasville 12.8 9 Milwaukee 12.8 11 Minneapolis-St. Paul 12.6 11 West Palm Beach-Ft. Pierce 12.6 11 Seattle-Tacoma 12.6 11 Tucson (Sierra Vista) 12.6 15 Green Bay-Appleton 12.5 16 San Diego 12.4 16 Baltimore 12.4 16 Washington, DC 12.4 16 Albany-Schenectady-Troy 12.4 20 New Orleans 12.3 20 St. Louis 12.3 20 Colorado Springs-Pueblo 12.3 23 Burlington-Plattsburgh 12.2 23 Syracuse 12.2 23 Norfolk-Portsmouth-Newport News 12.2 23 Spokane 12.2 23 Portland-Auburn 12.2 Source: Experian Simmons Adult residents of the markets listed below surely know how to have a good time-it's just unlikely to include a cocktail. The chart below lists the DMAs that consume the fewest alcoholic beverages per capita in a typical month. Residents of Chattanooga consume only 6 alcoholic beverages per month, on average, making it the least imbibing market-and probably the one that feels the best the morning after a big gathering. Rank DMA Average drinks per month 106 Chattanooga 6 105 Salt Lake City 7.2 105 Florence-Myrtle Beach 7.2 105 Charleston-Huntington 7.2 105 Tri-Cities, TN-VA 7.2 101 Knoxville 7.4 100 Lexington 7.9 99 Birmingham 8 98 Huntsville-Decatur 8.5 97 Nashville 8.9 97 Evansville 8.9 95 Paducah-Cape Girardeau-Harrisburg-Mt Vernon 9.1 94 Springfield, MO 9.2 94 Tulsa 9.2 94 Greenville-New Bern-Washington 9.2 91 Memphis 9.3 90 Greenville-Spartanburg-Asheville-Anderson 9.4 90 Jackson, MS 9.4 90 Wichita-Hutchinson Plus 9.4 86 Little Rock-Pine Bluff 9.5 86 Louisville 9.5 86 Ft. Smith-Fayetteville-Springdale-Rogers 9.5 83 Fresno-Visalia 9.6 82 Greensboro-High Point-Winston Salem 9.7 82 Roanoke-Lynchburg 9.7 Source: Experian Simmons For more information on SimmonsLOCAL's vivid reporting of consumer behaviors, attitudes, lifestyles and media consumption in 209 Designated Market Areas down to the ZIP code level, visit our website.
Registered Republicans and Democrats have different TV program preferences. But a majority of highly rated Nielsen programs seem to clearly skew Republican. Which TV programs does each group prefer, and what are the common threads among the two groups?
Discount stores appear to be weathering the recession better than some of their full-price counterparts, as they carry first-quality designer merchandise at competitive prices.