Loading...

How Cuebiq increased match rates amidst signal loss using Activity Feed

Published: June 26, 2024 by Lucy Simmonds

Cuebiq used Experian’s Activity Feed to resolve digital ad exposures to in-store purchases so that marketers could know the effectiveness of their clients’ media campaigns.

Cuebiq’s mission, as an offline intelligence and measurement company, is to deliver the most accurate and reliable insights on how digital marketing efforts impact offline consumer behavior. This case study shows how Cuebiq, despite signal loss, partnered with Experian to continue delivering in-store lift analyses. To achieve this, Cuebiq used Experian’s Activity Feed to resolve digital ad exposures to in-store purchases, so that marketers could know the effectiveness of their clients’ media campaigns.

Activity Feed helped Cuebiq increase its match rates by using all the identifiers supported in Experian’s signal-agnostic Digital Graph, reducing its reliance on third-party cookies. By partnering with Experian, Cuebiq could help their clients, marketers, more accurately measure their campaigns and optimize their media.

What is Activity Feed?

Experian’s Activity Feed pulls together fragmented digital event data from all digital channels, including browsers like Safari and Firefox that restrict traditional tracking methods. Activity Feed ingests and ties this digital ad exposure data to household or individual profiles hourly, helping clients associate that data to offline purchase activity made by that household or individual. Activity Feed plays a crucial role in overcoming fragmented data and helping marketers accurately measure their cross-channel marketing efforts.

Challenge: Increasing match rates across digital platforms

Cuebiq wanted to enhance how well they connect digital ad exposures, across web, mobile and connected TV (CTV) to specific mobile ad IDs (MAIDs), of those who visited clients’ stores. They needed a single technology partner who could collect data across these environments and improve these connections, especially as iOS updates, like iOS 14.5, posed potential challenges.

With the ability to resolve exposures to households, individuals, and MAIDs to then facilitate attribution of digital exposures to offline store visitation, Cuebiq could continue to provide accurate reports on how online ads impact offline consumer behavior. This clarity in data enables their clients to fine-tune their marketing strategies.

Cuebiq’s key objectives included:

  • Resolving digital exposures to MAIDs
  • Increasing overlap of offline and online data  
  • Improving the effectiveness of offline measurement offerings

Activity Feed: The solution to increase match rates

Cuebiq used Activity Feed to resolve data from cookieless environments like Safari to a single household or individual and saw significantly higher match rates. Cuebiq was able to track cross-channel media exposures, resolve them to MAIDs, and then use the Activity Feed output to correlate in-store visitation and sales to their clients’ media campaigns. Cuebiq also implemented the Experian pixel, which they placed to track all their marketers’ impressions (mobile, CTV, web traffic, etc.). The Experian pixel collects information in real-time, such as:

  • Timestamp
  • Cookies
  • Device ID (MAID/CTV) when available
  • IP address
  • User-Agent
  • Impression ID

“Before we started working with Experian, we couldn’t fully maximize ad views across the complex digital landscape. In just a few weeks, they were able to maximize the match rate across the fragmented digital inventory, solving a huge problem when it comes to cross-channel attribution.”

Luca Bocchiardi, Director of Product, Cuebiq

Results

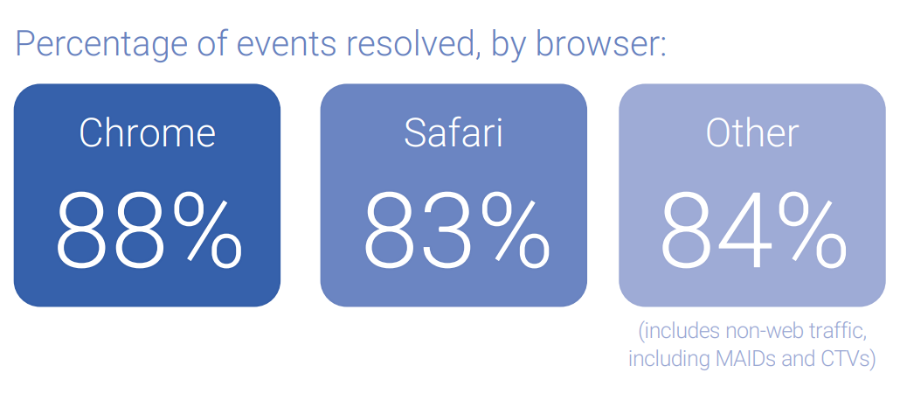
Activity Feed combines separate data streams and matches them back to a household. This enables Cuebiq to expand household IDs and accurately identify MAIDs that are seen in-store for cross-channel measurement. Over a 21-day period, Cuebiq passed ~1 billion events to Experian. Activity Feed resolved 85% of total events to a household, 91% of which were tied to MAIDs.

Percentage of events resolved by browser:  

Chrome: 88%  

Safari: 83%  

Other (including non-web traffic, including MAIDs and CTVs): 84%  

By implementing Activity Feed, Cuebiq was successfully able to:

  • Gain clearer insights into the success of their client‘s campaigns
  • Match consumer engagements in a privacy-compliant manner
  • Tell the story of the key performance indicators (KPIs) related to their marketing efforts

Prepare for a cookieless future with higher match rates

Activity Feed is prepared for a cookieless future and uses alternative IDs, like ID5 IDs, hashed emails, and IPs for identity resolution, ensuring no reliance on third-party cookies. Experian remains fully committed to exploring a suite of next-generation solutions and prioritizing continued testing of different industry solutions, including the Google Privacy Sandbox, to help customers prepare for a future without cookies. We’ve identified six viable alternatives to third-party cookies, how these alternatives fall short, and how Experian can help you navigate these alternatives.

“Experian’s customer service is extremely efficient and collaborative. We trust them to keep putting our business first long-term.”

Luca Bocchiardi, Director of Product, Cuebiq

Download the full case study to discover how Cuebiq used Activity Feed to overcome their challenges. Your path to maximizing match rates and resolving data from cookieless environments starts here.


About Cuebiq

Cuebiq is transforming the way businesses interact with mobility data to providing a high-quality and transparent currency to map and measure offline behavior. They are at the forefront of all industry privacy standards, establishing an industry-leading data collection framework, and making it safe and easy for businesses to use location data for innovation and growth.

To learn more, visit their website at www.cuebiq.com


Latest posts

Loading…
Everyone has loyalty campaigns, but few get the data right

It seems that every time I go into a store today, I am offered a loyalty card. From one of my favorite local restaurants to my shoe store VIP program, I feel like I am getting a host of emails and points at every turn. Statistics support my theory: according to a recent Experian Data Quality study, 91 percent of organizations use loyalty programs. Why did they become so prevalent? Today’s consumer is more empowered than ever before and driving major change within business. In the era of Yelp, digital channels and a 24/7 shopping cycle, organizations have less control. Just look at the shoe market, which you can tell I pay attention to. It used to be that you would purchase whatever your local department store or brick-and-mortar retail had to offer, which might be 50 different options. Now, you can go online, read reviews and browse hundreds of different choices based on style and color. In fact, last night I went online and searched for black boots and scrolled through six pages of different options! Loyalty programs are a counter balance to that choice and empowered customer behavior. They make sure that while I am shopping for shoes, I am probably doing it through my preferred store and earning reward points for free merchandise. And through the loyalty process, companies are collecting a lot of data. Customers usually need to provide more than three types of information to sign up, the most popular being email, followed by name and phone number. However, collecting this information accurately isn’t always easy, which is why poor data collection is one of the leading problems for loyalty programs. Eighty-one percent of companies face challenges related to these programs, the two biggest being not enough customers signing up and poor contact data. Inaccurate data means that a customer has signed up, but the marketer is unable to communicate with them in the desired channels. This clear drop in communication and a potentially bad customer experience could be by improved data collection. Sixty-four percent of respondents say this is a needed improvement. Let’s go back to my shoe retailer example. If they had collected my email wrong, I wouldn’t get my email confirmations or offers around upcoming sales. If they got my address wrong, I wouldn’t be receiving my shoes. Considering how much money I spend on shoes annually, which I am ashamed to admit, if any of those items went wrong, I might switch to a competitor. That can equate to a lot of money annually, especially when you look at it across a large number of clients. When a customer chooses to sign up for a loyalty program, they are making a commitment to the company and expecting something in return, be it points, free shipping, coupons or just company updates. However, if bad contact information is collected, then the consumer often never receives the benefits, resulting in a bad customer experience. In the next year, marketers need to data validation in place to ensure information is accurate upon collection. This type of software can be implemented across all channels where information is collected and ensure data is accurate while the consumer is still engaged. If information is accurate when it is collected, then loyalty programs have a better chance at engaging consumers and actually seeing the benefit that a loyalty program can provide. To learn more about loyalty programs and the research mentioned above, please read our new white paper, Driving customer loyalty.

Nov 19,2014 by

Trends marketers need to know right this minute

When building marketing plans these are the top trends marketers need to know and consider Crowdsourcing, Programmatic Buying, The Internet of Things … these are all concepts that today’s savvy marketer needs to be thinking about. We can’t emphasize it enough: the marketing landscape changes almost daily, sometimes without us even realizing it. The three concepts I just mentioned weren’t even part of our lexicon a few short years (or even months) ago, but are now important trends marketers need to know and consider when building out marketing plans. Take crowdsourcing, for example. Experian Marketing Services research showed that the number of ratings or reviews posted online has increased by 30 percent in the past two years and the number of adults who say they pay attention to such reviews has increased by 33 percent. Brands are capitalizing on the trend by engaging their consumers in communities that share their content and even help them design new products. Programmatic Buying, which refers to the automation of online ad buying, has exploded over the last few years as publishers like AOL have started focusing less on selling remnant inventory and started offering their premium inventory to advertisers up front. This has led to the packaging of “audiences” that marketers can use to target customers across channels and devices. And one of this year’s biggest trends is the rise of the “Internet of Things,” which is, essentially, everyday objects that connect to the Internet to improve efficiency, connectivity and user experience. Think smart light bulbs that you can control from your smartphone, or smart thermostats that also connect to your phone and allow you to adjust the temperature in your house before you get home from work. If you find these concepts interesting, please read “Trending Now” to get more insights into these trends marketers need to know and several other fresh marketing ideas that are changing the way marketers are thinking about planning today.

Oct 15,2014 by

Ask the analyst: Are consumers really cutting the cord?

Q&A with John Fetto, Senior Analyst, Marketing & Research Earlier this year, Experian Marketing Services released our Cross-Device Video Analysis. The analysis has generated such strong and sustained interest from marketers and the media, we wanted to explore the subject further. The following is an exchange with the report’s lead author John Fetto who answers some common questions that we’ve received since the analysis was published. Q: In the Cross-Device Video Analysis, you report that consumers are “cutting the cord” on pay cable and satellite television services. Can you elaborate on this trend? What’s driving it? According to our research at Experian Marketing Services, U.S. consumers are increasingly likely to have high speed Internet at home but no cable or satellite TV subscription. There are two primary consumer trends driving this: 1) Households that never subscribed to a pay TV service are now upgrading to broadband Internet; 2) Households that previously subscribed to both pay TV service and broadband Internet that have since cancelled the cable or satellite TV subscription. While the vast majority of U.S. households pay for either cable or satellite TV, an estimated 15.1 million (or 12.9 percent of households) do not. That’s up from 13.5 million households (11.9 percent) who didn’t pay for TV in 2009. At the same time, the share of broadband households is also rising. Today, 72.7 million homes (61.4 percent) have broadband Internet, up from 65.0 million homes (56.9 percent) in 2009. As Americans’ Internet connection at home is increasingly fast enough to deliver high quality video content through sites like YouTube, Netflix, Hulu and the like, as well as the ability to consume that online video content across an array of devices ranging from Internet-connected televisions to smartphones and tablets to computers, they are increasingly questioning whether they need to continue paying for TV. And more and more consumers are deciding to cut the cord. Q: With more consumers cutting the cord, how are they consuming video content? While the most commonly used device to consume online video is the smartphone — used by 24 percent of adults during a typical week to watch online video, according to our research — “cord cutters” are primarily using Internet-connected TV to consume online video. In fact, an adult who watches online video on their TV is 3.2 times more likely than the average adult to be a cord-cutter. This means that the Internet-connected TV market is critical in predicting the future of the cord-cutting consumer. As existing devices like Apple TV, Chromecast and Roku are upgraded and new devices like Amazon Fire TV are introduced to the market, consumers will have more and more options to consume online video without sacrificing quality or screen size. As a result, more consumers will be reconsidering whether they need to continue paying for TV. Q: What percent of consumers get their television programming from various sources including cable, satellite, online streaming and free over the air TV? Combined, 87.1 percent of U.S. households subscribe to either cable or satellite TV. While Experian Marketing Services doesn’t specifically measure the percent of Americans who watch TV through an over the air feed (OTA) we know that among those who do not subscribe to cable or satellite, the vast majority (77 percent) still watch TV. And while it’s possible that some are viewing TV from a cable or satellite feed away from home, the most likely source of their TV content would be from OTA sources. That means that at least 10 percent of American adults are watching some TV through an OTA feed. In addition, 48 percent of all adults watch online video each week through a variety of devices. Those who don’t pay for TV are 12 percent more likely than those who have cable or satellite TV to watch online video (54 percent vs 48 percent). Q: The cord-cutting trend has many implications for the cable and satellite companies, but what do consumer-facing marketers and advertisers need to know about this trend? The growth in online video viewing creates many opportunities for marketers. Online audiences can be more easily targeted and served up advertising that is more relevant, responsive and measureable. Marketers can also be more confident that their online ad was actually seen, given that viewers are typically unable to skip ads. And while CPMs for online video ads may generally be lower than those of TV, marketers can use that savings to negotiate costs based on clicks or transactions rather than impressions, giving them a better picture into audience interest and insights to inform their budget allocation. Millennials are the most device “agnostic,” with more than one-third saying they don’t mind watching video on a portable device even if it means a smaller screen. That’s more than double the rate of those ages 35 and older. This decentralized viewing can create headaches for marketers who need to start a relationship with Millennials during this stage of their lives when they’re most open to trying out new brands and have yet to settle down. On the plus side, marketers who do manage to reach this audience will find them much more open to advertising than average. In fact, Millennials are more than four times more likely to say that video ads that they view on their cell phone are useful. So while the challenge is big, so is the potential reward.   Download the full analysis to learn more about: Cross-device video behaviors to optimize media mix approach The impact of the growing trend in cord-cutters The rising influence of Internet-connected TV How to get more impact from video content

Oct 08,2014 by

Subscribe to our newsletter

Enter your name and email for the latest updates

This site is protected by reCAPTCHA and the Google Privacy Policy and Terms of Service apply.

About Experian Marketing Services

At Experian Marketing Services, we use data and insights to help brands have more meaningful interactions with people. As leaders in the evolution of the advertising landscape, Experian Marketing Services can help you identify your customers and the right potential customers, uncover the most appropriate communication channels, develop messages that resonate, and measure the effectiveness of marketing activities and campaigns.

Visit our website

Subscribe to our newsletter

Stay up to date on the latest industry news and receive expert tips from our marketing experts.
Subscribe now!