
Today, Experian is excited to introduce our Offline Graph as a standalone product that clients can license, marking a significant step in our commitment to powering data-driven advertising through connectivity. Offline Graph empowers advertisers and advertising technology companies to build and refine consumer profiles, contributing to data connectivity, more offline audience reach, and improved offline measurement accuracy.
As a result of consumers engaging with content across more channels, there are more disparate data points than ever before. When you couple that with ongoing signal loss, the need for a unified identity solution has never been greater.
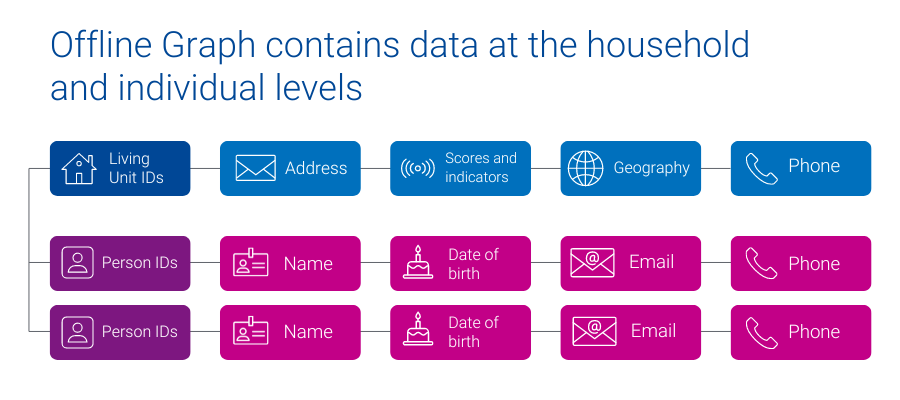
Experian’s Offline Graph offers companies a license of stable offline data points, like name, address, phone number, email, geographic information, date of birth, and additional attributes that provide a complete view of household and individual identities. The Offline Graph integrates known offline identity information from reliable deterministic sources like property ownership records, public records, and marketing data to provide access to all United States consumers and households.

How customers can use the Offline Graph
- A big box retailer fills in the blanks of their existing customer data and builds a database of prospects.
- A media platform more effectively onboards advertisers’ segments, enabling advertisers to reach more of their customers.
- A retail brand better understands their customer’s demographic and behavioral make-up, by licensing Offline Graph with Marketing Attributes.
- A connected TV (CTV) manufacturer increases audience reach and accurately quantifies the campaign impact for their advertising partners.
Experian’s Offline Graph is already driving value across industries. Here’s some in-depth client success stories:
Fusion92 licenses Offline Graph to help their clients transform their marketing
Fusion92 is a marketing partner that fuels business transformation in today’s digital economy and delivers exponential returns for brands.
Fusion92 licenses Experian’s Offline Graph to power their strategy: from research and discovery to audience creation, activation, and measurement. With access to our Offline Graph, Fusion92 ensures their clients get the insights, targeting, reach, and measurement they need to achieve their business goals.
“At Fusion92, we are always pushing the envelope to develop solutions that lead to success for our clients. Our desire to innovate pushed us to find an industry-leading partner in data and identity. This led to us licensing Experian’s Offline Graph product, which we use to build more complete audience profiles for our clients. In doing so, we help brands target, activate, and measure their marketing campaigns more effectively, leading to superior results.”
dave nugent, executive vice president of data and analytics, fusion92
Using Offline Graph to deliver relevant messaging to multiple audience cohorts
A leading direct-to-consumer (DTC) company with strong customer relationships built a robust first-party data set, enabling effective customer retention. To attract new customers, they partnered with Experian to access offline identity data from Experian’s Offline Graph. The Offline Graph provides them with the data needed to validate their first-party data and with the keys to unlock new customers.
With this data, the DTC company delivered the right message to both sets of consumers: existing customers and new prospects. By integrating Experian’s Offline Graph they broadened their reach, personalized their messaging, and improved their marketing.
What sets Experian’s Offline Graph apart from the competition
- Stability of data: With data from deterministic sources, our Offline Graph ensures that your view of consumers – and your ability to connect with them – is stable over time.
- Connected digital and offline data: Seamlessly connect offline data with digital identifiers through our Digital Graph, enabling a holistic approach to marketing, while ensuring consumer privacy is prioritized.
- Tailor made for your use cases: Build the Offline Graph to fit your specific needs, selecting the exact offline identity information required for your campaigns.
- Expanded consumer insights: Connect more data points to enrich your understanding of consumer demographics and behavior, using Experian’s Marketing Attributes and Audiences data.
Offline Graph: Your gateway to consumer connectivity
As signals fade, there is a large emphasis on procuring and having accurate consumer data. Experian’s Offline Graph delivers the connectivity and insights necessary to stay ahead. Whether you aim to strengthen your existing data or access entirely new data sets, Experian’s Offline Graph offers a solution tailored to your needs. Transform your data strategy with Experian’s Offline Graph — your gateway to a unified consumer identity solution.
Latest posts

Retailers are realizing that a large percentage of their revenue stream comes from existing customers, which is why so many starting to invest in customer loyalty programs. A recent Experian QAS study revealed that 63 percent of organizations track the lifetime value of each customer, and 72 percent see that value increasing over time. Loyalty programs are an effort to promote up-sell and cross-sell opportunities to make sure customers continue to buy throughout their lifecycle. However, simply investing in a loyalty program isn’t enough; retailers need to be sure that the contact data in those programs is accurate. At the most basic level, marketing offers can only reach customers when the contact information is accurate, but contact data also affects a retailer’s ability to analyze their current customer base to allow better segmentation and intelligence. To ensure data accuracy, make sure to put verification tools in place at each point of capture so that contact data is valid and complete as it is being entered. Then make sure you are updating data on a consistent basis and that it is being put into one centralized database for better analysis. Learn more about the author, Erin Haselkorn

Marketers traditionally use income, net worth and income-producing assets to enhance their consumer targeting efforts. However, these data elements provide insight only into spending capacity, not how much is actually being spent. Consumers who appear nearly identical in terms of demographics may, in fact, vary widely when it comes to discretionary spending. Some are savers, some are spenders and some have more financial obligations than others. Experian Marketing Services offers data-driven marketers a way to cut straight to the chase when targeting consumers by out-of-pocket expenditures with the Discretionary Spend Estimate. This estimate is available for direct marketing applications to enhance marketers’ targeting efforts as well as an add-on to the Simmons National Consumer Study (NCS) providing marketers with the ability to evaluate discretionary spending against any of the 60,000 consumer variables measured in the study offered by Experian Simmons. In the new 2011 Discretionary Spend Report, Experian Simmons presents a vivid profile of American households by the amount spent annually on nonessential goods and services, including things like entertainment, dining out, personal care, etc. For starters, we report that an estimated 28% of Americans’ annual household spending is on discretionary goods and services. Specifically: The typical U.S. household today shells out $12,800 annually on discretionary expenditures Over half of households spend less than $10,000 on discretionary purchases each year, including just over a third that spend less than $7,000 annually Only 5.8% of American households spend $30,000 or more per year on nonessential goods and services, including 2.2% that spend $40,000 or more annually Distribution of U.S. households, by annual discretionary spending Furthermore, we estimate that, in aggregate, Americans spend $1.47 trillion annually on discretionary goods and services. Despite the fact that households spending less than $7,000 on nonessentials comprise over a third of all households, this segment of the population accounts for just 10.8% of total annual discretionary spending in the United States. Combined, households spending less than $7,000 annually contribute $158.3 billion in discretionary spending to the economy at large The top 2.2% of spenders (those households that spend $40,000 a year or more on nonessentials) account for fully 11.2% of the nation's total annual discretionary spending Households spending between $20,000 and $29,999 annually on nonessential purchases account for the largest single share of the nation’s spending: $305.1 billion Proportion of nation’s total annual discretionary spending, by spend segment Total annual discretionary spend contribution, by spend segment Understanding the pocketbooks of America’s spenders is one thing, but understanding what’s going on in their heads is another. Luckily, Experian Simmons delivers the mindset of the American consumers; below is a look at select attitudes that uncover real differences in personalities and lifestyles of Americans depending on their annual discretionary spending. Highlights include: 46% of high spenders say they often drink alcoholic beverages making them 77% more likely than the average U.S. adult to do so High spenders like to drive faster than normal while low spenders like to drive alone for a sense of freedom Low spenders say that “money is the best measure of success,” but they also say they “don’t want responsibility” High spenders say they are often chosen to be the spokesperson of a group Check back here for more posts on America’s discretionary spending habits and behaviors or download the full 2011 Discretionary Spend Report now.

The BRICs markets (Brazil, Russia, India and China) are becoming ever larger forces in the world economy. For some time their growth rates have been faster than those experienced in western economies, and they have borne the recent economic crisis with greater resilience. In many ways it's wrong to refer to the BRICs as "developing" markets — by some measures they can be considered just as developed as the "developed" markets. Manufacturers and service providers have to be interested in the BRICs. Their sheer size, allied with these growth rates, means they offer huge potential. Growth rates in the BRICs for a range of items have been rapid. Data from Global TGI, an international network of market and media research companies spanning over 50 countries and six continents, shows this very clearly. In this post we look at three examples in diverse sectors. These charts show the trend over the last decade in the ownership in the BRICs markets of cars, microwave ovens and bank cards. They are based on the total measured urban adult Global TGI population in all cases. We can also compare this with the trend in the U.S. sourcing data from Experian Simmons. Boom in car ownership There has been dramatic increase in the ownership of cars over the last decade in Russia (80%), India (90%) and China (200% growth). These rates of growth are a clear sign of how economic development spreads wealth and makes items affordable to increasing numbers of consumers. The exception to this picture is Brazil, where car ownership was considerably higher than in the other BRICs at the opening of the new century, and growth has been more serene. By comparison to the BRICs we see from Experian Simmons that in the U.S. (as well as Great Britain) there has been virtually no percentage growth — new purchases are largely replacement purchases. The microwave oven market heats up Purchasing a microwave oven for your home is by no means as expensive an undertaking as purchasing a car, but it requires the availability of sufficient disposable income. In this category we see from Global TGI significant growth in all the BRICs over the last decade — from a 50% increase in Brazil to over 700% in Russia. The growth story in Russia is typical of many categories in fast-growing markets: ten years ago a microwave oven was still an expensive item for most households given their purchasing capacity, and ownership was largely the preserve of the well-off. Subsequently however, it has become affordable as well as being regarded as necessary by most people, and penetration has grown dramatically. As with automobiles, growth of microwave ovens in the U.S. has remained flat with fully 89% of all American homes already owning a microwave. Financial sophistication The growth in ownership of credit and debit cards arises from people's need to manage money, and greater levels of financial sophistication. Clearly it also represents a huge opportunity for financial institutions. It has been striking across all the BRICS — and there is still potential for more, perhaps in India most of all. Again we see from very little growth over the same period in the U.S. and Britain, which were already saturated. Today, 83% of Americans have a debit or credit card, as do 90% of Brits. Consumer growth in the BRICs will continue Across many other categories the same picture can be seen, of rapid growth yet still much further potential. We can anticipate growth in the BRICs and other developing markets continuing to outpace growth in western markets across the full range of consumption categories. With economic growth happening at different speeds this trend seems likely to last for a long time. Furthermore, it's not only that they are growing faster. In population terms, the BRICs together represent 42% of the people of the world. Their large populations mean that they will increasingly dominate world markets in absolute numbers too. When this rapid macro-economic development is considered along with the sheer size of their consumer markets and the speed of their growth evident from these Global TGI figures, it is very clear why many manufacturers are focusing attention very closely on the BRICs. Learn more about how Experian Simmons and Global TGI can provide you with consumer insights across the globe with comparisons to the United States.