Loading...

Introducing Experian’s Offline Graph

Published: October 8, 2024 by Experian Marketing Services

Unifying consumer identity across channels with Experian's Offline Graph

Today, Experian is excited to introduce our Offline Graph as a standalone product that clients can license, marking a significant step in our commitment to powering data-driven advertising through connectivity. Offline Graph empowers advertisers and advertising technology companies to build and refine consumer profiles, contributing to data connectivity, more offline audience reach, and improved offline measurement accuracy.

As a result of consumers engaging with content across more channels, there are more disparate data points than ever before. When you couple that with ongoing signal loss, the need for a unified identity solution has never been greater.

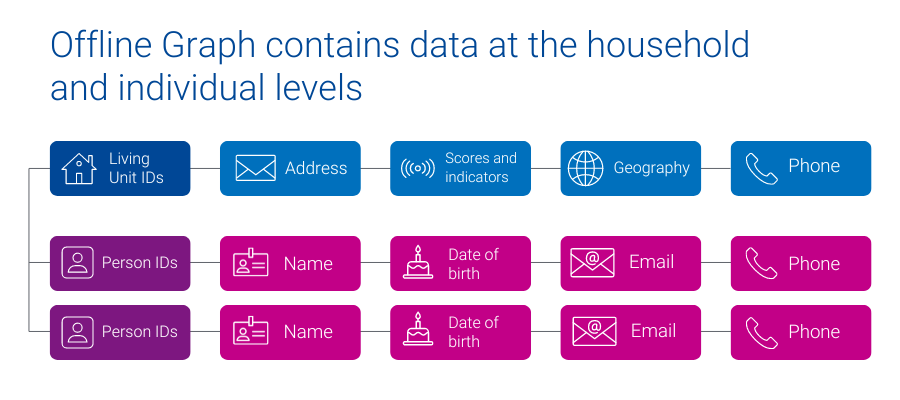
Experian’s Offline Graph offers companies a license of stable offline data points, like name, address, phone number, email, geographic information, date of birth, and additional attributes that provide a complete view of household and individual identities. The Offline Graph integrates known offline identity information from reliable deterministic sources like property ownership records, public records, and marketing data to provide access to all United States consumers and households.

Experian's Offline Graph contains data at the household and individual levels

How customers can use the Offline Graph

  • A big box retailer fills in the blanks of their existing customer data and builds a database of prospects.
  • A media platform more effectively onboards advertisers’ segments, enabling advertisers to reach more of their customers.
  • A retail brand better understands their customer’s demographic and behavioral make-up, by licensing Offline Graph with Marketing Attributes.
  • A connected TV (CTV) manufacturer increases audience reach and accurately quantifies the campaign impact for their advertising partners.

Experian’s Offline Graph is already driving value across industries. Here’s some in-depth client success stories:

Fusion92 licenses Offline Graph to help their clients transform their marketing

Fusion92 is a marketing partner that fuels business transformation in today’s digital economy and delivers exponential returns for brands.

Fusion92 licenses Experian’s Offline Graph to power their strategy: from research and discovery to audience creation, activation, and measurement. With access to our Offline Graph, Fusion92 ensures their clients get the insights, targeting, reach, and measurement they need to achieve their business goals.

“At Fusion92, we are always pushing the envelope to develop solutions that lead to success for our clients. Our desire to innovate pushed us to find an industry-leading partner in data and identity. This led to us licensing Experian’s Offline Graph product, which we use to build more complete audience profiles for our clients. In doing so, we help brands target, activate, and measure their marketing campaigns more effectively, leading to superior results.”

dave nugent, executive vice president of data and analytics, fusion92

Using Offline Graph to deliver relevant messaging to multiple audience cohorts

A leading direct-to-consumer (DTC) company with strong customer relationships built a robust first-party data set, enabling effective customer retention. To attract new customers, they partnered with Experian to access offline identity data from Experian’s Offline Graph. The Offline Graph provides them with the data needed to validate their first-party data and with the keys to unlock new customers.

With this data, the DTC company delivered the right message to both sets of consumers: existing customers and new prospects. By integrating Experian’s Offline Graph they broadened their reach, personalized their messaging, and improved their marketing.

What sets Experian’s Offline Graph apart from the competition

  • Stability of data: With data from deterministic sources, our Offline Graph ensures that your view of consumers – and your ability to connect with them – is stable over time.
  • Connected digital and offline data: Seamlessly connect offline data with digital identifiers through our Digital Graph, enabling a holistic approach to marketing, while ensuring consumer privacy is prioritized.
  • Tailor made for your use cases: Build the Offline Graph to fit your specific needs, selecting the exact offline identity information required for your campaigns.
  • Expanded consumer insights: Connect more data points to enrich your understanding of consumer demographics and behavior, using Experian’s Marketing Attributes and Audiences data.

Offline Graph: Your gateway to consumer connectivity

As signals fade, there is a large emphasis on procuring and having accurate consumer data. Experian’s Offline Graph delivers the connectivity and insights necessary to stay ahead. Whether you aim to strengthen your existing data or access entirely new data sets, Experian’s Offline Graph offers a solution tailored to your needs. Transform your data strategy with Experian’s Offline Graph — your gateway to a unified consumer identity solution.


Latest posts

Loading…
The Marketing Bowl: Packers vs. Steelers

Two storied franchises will collide in this year’s Super Bowl, the Green Bay Packers and the Pittsburgh Steelers. Sports fans from both markets are huge supporters of their football teams, but a look into their behavior and attitudes reveals passions beyond a one-dimensional Cheesehead or Towel Twirler. Considering the vast preferences, marketers recognize the need to define characteristics that truly distinguish their target audience. To provide those insights, we conducted a detailed market analysis using a wide variety of data sources including research information from Experian Simmons, Hitwise, and the Mosaic Consumer Lifestyle segmentation solution, which defines the predominant household types for each area (as featured in yesterday’s post: Cheeseheads vs. Terrible Towels). Today, we delve further into the hearts and houses of Green Bay and Pittsburgh area residents. GREEN BAY FANS PACK THEM IN FOR TAILGATING Green Bay area residents are more passionate about tailgating compared to their rivals in Pittsburgh. Among those who identify themselves as NFL football fans, Green Bay fans are 1.45 times more likely than Pittsburgh fans to have participated in a tailgate party within the past 12 months. They are also better equipped to tailgate due to a higher ownership rate for midsize SUVs, and both light duty and full size pickups (Road & Track magazine top-rated picks for tailgating), compared to Pittsburgh fans. STELLA AND STEELERS GO TOGETHER With every tailgate comes a beverage of choice, and in today’s analysis we’ve found that Bud Light and Budweiser are the light/low calorie and regular domestic brands of beer favored the most by both Green Bay and Pittsburgh fans. However, Pittsburgh fans are 1.56 times more likely than Green Bay fans to down a few of premium brand, Stella Artois. Notably, along with its best selling brands, Anheuser-Busch plans to devote a portion of its multi-million dollar ad spend to this Belgian import. FANTASIZING ABOUT FOOTBALL While all that tailgating is going on, Green Bay fans might also be boasting about their latest fantasy sports selections. They are 1.34 times more likely to say that they participate in a fantasy sports league compared to Pittsburgh fans. That’s not to say that Pittsburgh fans don’t enjoy their fantasy sports, indexing above the national average for visiting fantasy sports and football websites. PLAYING IN THE GREAT OUTDOORS Packers and Steelers fans enjoy being out in the elements, so chances are you’ll probably never see a dome over either Lambeau or Heinz Field. The most popular Green Bay football fan activities, with a higher participation rate compared to Pittsburgh fans, are: golfing, camping, state fairs, hunting, power boating and motorcycling. In the Pittsburgh area, with its impressive network of recreational trails, residents are 1.23 times more likely to in-line/roller skate and are 1.36 times more likely to play hockey, compared to Green Bay. Off land analysis shows that despite Green Bay residents’ close proximity to Lake Michigan and a multitude of water sport opportunities, Pittsburgh fans are more likely to spend time on the water, namely: canoeing, kayaking, sailing, and fly fishing. THROWING DEEP VERSUS HANDING OFF Each year Super Bowl advertisers try to reach their audiences across broadly defined demographics with little ability to measure the direct impact of their super-sized investments. It’s the equivalent of throwing a “Hail Mary” and hoping the receiver will leap above the clutter of defenders and catch the ball. Direct marketers, however, are using the behavioral and attitudinal data we’ve shared here to deliver their messages to a precisely targeted sub-audience. For marketers who want to be relevant and target accurately, this capability is the playmaker that scores a game winning touchdown every time. Click here for the full article Blog post author: Bill Schneider, VP, Experian Marketing Services. We’d love to hear your stories and how you’ve used lifestyle data. Please leave your comments or feedback below.

Feb 03,2011 by

Americans Spend 2 Hours, 12 Minutes Per Month on Twitter.com

According to weekly trend data from Experian Simmons DataStreamSM, the number of U.S. adults paying a monthly visit to microblogging site Twitter.com has fallen during the past year by 14%. As of November 29, 2010, 8.25 million adults had made at least one visit to Twitter.com during the previous 30 days, down from 9.54 million adults who had visited the site in the 30 days prior to November 30, 2009. Does this mean the ultimate “fail whale” is lurking just over the horizon for Twitter? Not just yet. Among those who visit Twitter.com, Simmons DataStream shows that the average number of visits per month rose a relative 37% in the last year. Twitter.com visits in late November 2010, in fact, reached an average of 10.0 visits per month, up from just 7.3 visits per month the year prior. As visit frequency increased, however, the duration of the average Twitter.com session declined, suggesting visitors today are seeking more frequent quick hits, rather than spending longer periods of time reading through posts. According to Experian Hitwise, the average amount of time Twitter.com visitors spend on the site during a typical session fell to 13 minutes, 12 seconds on November 27, 2010, down from an average of 15 minutes, 12 seconds spent on the site each session on November 28, 2009. That said, Americans are still spending more time on Twitter.com than ever before. According to Experian Simmons estimates, Americans spent an estimated 2 hours and 12 minutes tweeting and reading tweets on Twitter.com in November 2010, up from 1 hour and 51 minutes spent on the site during November 2009. Swim on, fail whale, swim on. To tweet this blog post, click on the green “retweet” button at the top of this item. For more information on Simmons DataStream weekly reporting of nearly 40,000 consumer variables, visit our website.

Jan 25,2011 by

The Top Drinking Cities in the U.S.

As we ring in the New Year this week, Americans will be tossing back a few adult beverages in celebration. While alcohol consumption certainly increases around holidays and other times of celebration, many Americans imbibe year-round. So where across this great land of ours are you most likely to find adults willing and able to raise a glass (or two) and where are you most likely to be surrounded by teetotalers? Experian Simmons has the answer. Leveraging data from our SimmonsLOCAL study, we examined the drinking patterns of adults of legal drinking age in the 106 Designated Market Areas (DMAs) with populations of at least 500,000 adults age 21 and older.  We then ranked those markets by the number of alcoholic beverages consumed by the average adult during a typical month. The chart below lists the DMAs that consume the most alcoholic beverages per capita in a typical month. First place goes to Boston, where the average adult of legal drinking age regularly kicks back 14.4 drinks a month. (Celebrations in Beantown are probably already underway.) Rank DMA Average drinks per month 1 Boston 14.4 2 Austin 13.8 3 Providence-New Bedford 13.4 4 Madison 13.2 4 Hartford & New Haven 13.2 6 Philadelphia 13.1 7 Chicago 13 8 Denver 12.9 9 Tallahassee-Thomasville 12.8 9 Milwaukee 12.8 11 Minneapolis-St. Paul 12.6 11 West Palm Beach-Ft. Pierce 12.6 11 Seattle-Tacoma 12.6 11 Tucson (Sierra Vista) 12.6 15 Green Bay-Appleton 12.5 16 San Diego 12.4 16 Baltimore 12.4 16 Washington, DC 12.4 16 Albany-Schenectady-Troy 12.4 20 New Orleans 12.3 20 St. Louis 12.3 20 Colorado Springs-Pueblo 12.3 23 Burlington-Plattsburgh 12.2 23 Syracuse 12.2 23 Norfolk-Portsmouth-Newport News 12.2 23 Spokane 12.2 23 Portland-Auburn 12.2 Source: Experian Simmons Adult residents of the markets listed below surely know how to have a good time-it's just unlikely to include a cocktail. The chart below lists the DMAs that consume the fewest alcoholic beverages per capita in a typical month. Residents of Chattanooga consume only 6 alcoholic beverages per month, on average, making it the least imbibing market-and probably the one that feels the best the morning after a big gathering. Rank DMA Average drinks per month 106 Chattanooga 6 105 Salt Lake City 7.2 105 Florence-Myrtle Beach 7.2 105 Charleston-Huntington 7.2 105 Tri-Cities, TN-VA 7.2 101 Knoxville 7.4 100 Lexington 7.9 99 Birmingham 8 98 Huntsville-Decatur 8.5 97 Nashville 8.9 97 Evansville 8.9 95 Paducah-Cape Girardeau-Harrisburg-Mt Vernon 9.1 94 Springfield, MO 9.2 94 Tulsa 9.2 94 Greenville-New Bern-Washington 9.2 91 Memphis 9.3 90 Greenville-Spartanburg-Asheville-Anderson 9.4 90 Jackson, MS 9.4 90 Wichita-Hutchinson Plus 9.4 86 Little Rock-Pine Bluff 9.5 86 Louisville 9.5 86 Ft. Smith-Fayetteville-Springdale-Rogers 9.5 83 Fresno-Visalia 9.6 82 Greensboro-High Point-Winston Salem 9.7 82 Roanoke-Lynchburg 9.7 Source: Experian Simmons For more information on SimmonsLOCAL's vivid reporting of consumer behaviors, attitudes, lifestyles and media consumption in 209 Designated Market Areas down to the ZIP code level, visit our website.

Dec 29,2010 by

Subscribe to our newsletter

Enter your name and email for the latest updates

This site is protected by reCAPTCHA and the Google Privacy Policy and Terms of Service apply.

About Experian Marketing Services

At Experian Marketing Services, we use data and insights to help brands have more meaningful interactions with people. As leaders in the evolution of the advertising landscape, Experian Marketing Services can help you identify your customers and the right potential customers, uncover the most appropriate communication channels, develop messages that resonate, and measure the effectiveness of marketing activities and campaigns.

Visit our website

Subscribe to our newsletter

Stay up to date on the latest industry news and receive expert tips from our marketing experts.
Subscribe now!