
Today, Experian is excited to introduce our Offline Graph as a standalone product that clients can license, marking a significant step in our commitment to powering data-driven advertising through connectivity. Offline Graph empowers advertisers and advertising technology companies to build and refine consumer profiles, contributing to data connectivity, more offline audience reach, and improved offline measurement accuracy.
As a result of consumers engaging with content across more channels, there are more disparate data points than ever before. When you couple that with ongoing signal loss, the need for a unified identity solution has never been greater.
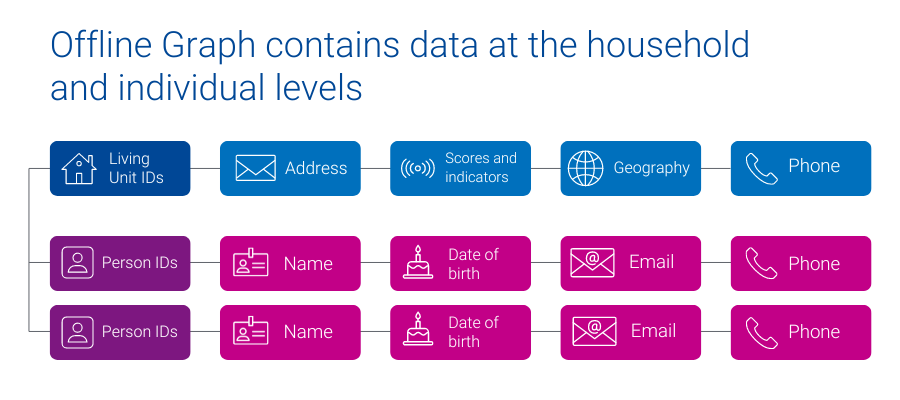
Experian’s Offline Graph offers companies a license of stable offline data points, like name, address, phone number, email, geographic information, date of birth, and additional attributes that provide a complete view of household and individual identities. The Offline Graph integrates known offline identity information from reliable deterministic sources like property ownership records, public records, and marketing data to provide access to all United States consumers and households.

How customers can use the Offline Graph
- A big box retailer fills in the blanks of their existing customer data and builds a database of prospects.
 - A media platform more effectively onboards advertisers’ segments, enabling advertisers to reach more of their customers.
 - A retail brand better understands their customer’s demographic and behavioral make-up, by licensing Offline Graph with Marketing Attributes.
 - A connected TV (CTV) manufacturer increases audience reach and accurately quantifies the campaign impact for their advertising partners.
 
Experian’s Offline Graph is already driving value across industries. Here’s some in-depth client success stories:
Fusion92 licenses Offline Graph to help their clients transform their marketing
Fusion92 is a marketing partner that fuels business transformation in today’s digital economy and delivers exponential returns for brands.
Fusion92 licenses Experian’s Offline Graph to power their strategy: from research and discovery to audience creation, activation, and measurement. With access to our Offline Graph, Fusion92 ensures their clients get the insights, targeting, reach, and measurement they need to achieve their business goals.
“At Fusion92, we are always pushing the envelope to develop solutions that lead to success for our clients. Our desire to innovate pushed us to find an industry-leading partner in data and identity. This led to us licensing Experian’s Offline Graph product, which we use to build more complete audience profiles for our clients. In doing so, we help brands target, activate, and measure their marketing campaigns more effectively, leading to superior results.”
dave nugent, executive vice president of data and analytics, fusion92
Using Offline Graph to deliver relevant messaging to multiple audience cohorts
A leading direct-to-consumer (DTC) company with strong customer relationships built a robust first-party data set, enabling effective customer retention. To attract new customers, they partnered with Experian to access offline identity data from Experian’s Offline Graph. The Offline Graph provides them with the data needed to validate their first-party data and with the keys to unlock new customers.
With this data, the DTC company delivered the right message to both sets of consumers: existing customers and new prospects. By integrating Experian’s Offline Graph they broadened their reach, personalized their messaging, and improved their marketing.
What sets Experian’s Offline Graph apart from the competition
- Stability of data: With data from deterministic sources, our Offline Graph ensures that your view of consumers – and your ability to connect with them – is stable over time.
 - Connected digital and offline data: Seamlessly connect offline data with digital identifiers through our Digital Graph, enabling a holistic approach to marketing, while ensuring consumer privacy is prioritized.
 - Tailor made for your use cases: Build the Offline Graph to fit your specific needs, selecting the exact offline identity information required for your campaigns.
 - Expanded consumer insights: Connect more data points to enrich your understanding of consumer demographics and behavior, using Experian’s Marketing Attributes and Audiences data.
 
Offline Graph: Your gateway to consumer connectivity
As signals fade, there is a large emphasis on procuring and having accurate consumer data. Experian’s Offline Graph delivers the connectivity and insights necessary to stay ahead. Whether you aim to strengthen your existing data or access entirely new data sets, Experian’s Offline Graph offers a solution tailored to your needs. Transform your data strategy with Experian’s Offline Graph — your gateway to a unified consumer identity solution.
Latest posts

With the 82nd Academy Awards® just around the corner and only days before final voting ballots are due back to accounting firm PricewaterhouseCoopers, Experian Simmons is taking a close look at the American movie-going population. In any given month, over 56 million adults (26% of the adult population) make a trip to the cinema to take in a film. Movie-going typically reaches its peak in mid-summer, and 2009 was no exception. Experian Simmons DataStreamSM reports that in July of last year, 32% of adults went to movies, the highest level observed at any point in the year. In October of the same year, the percentage of past-month adult cinema-goers had dropped to just 19%, the lowest point observed in all of 2009. In this month’s Consumer Insights report, Experian Simmons sizes the movie-going audience, examines their receptivity to cinema ads—including pre-show commercials and product placement within films—online movie searches as well as Americans’ penchant for tuning into the Academy Awards. All data comes from the Simmons Summer 2009 National Consumer Study. Two-thirds of the adult population have gone to the movies at least once in the last 6 months. Nearly half (46%) have been in the last 90 days and a quarter (26%) have been in the last month. Young adults are, as expected, more likely to go to the movies than older adults, but adults over 50 outnumber young adults when it comes to raw number of movie-goers as you will see in the following chart. Over 147 million individuals have gone to the movies at least once in the last 6 months. With 20.8 million adults ages 18 to 24 going to the movies in the last 6 months, this age group accounts for only 14% of the movie-going population. Adults ages 50 and over, on the other hand, account for 37% of the movie-going population with over 55 million adults in this age group going to the theater at least once in the last 6 months. Among all adults who had been to the movies at least once in the last 6 months, 68% have been at least once in the last 30 days. Many movie-goers (39%) have been only once in the last month and only 7% have been four or more times. Young adults ages 18 to 24 are much more likely than the average movie-goer to have been to the theater in the last month with 75% reporting having been at least once and 10% having been 4 times or more. Experian Simmons DataStreamSM reports similar trends in past 30 day movie-going for 2008 and 2009 with the peak for this behavior occurring in both years on almost the exact same date. During the week of July 22, 2009 32% of adults reported having been to the theater during the last 30 days and during the week of July 21, 2008, 29% reported going. Cinema Blockbusters that month in ’09 included Bruno and Harry Potter and the Half-Blood Prince. In July of ’08, Mama Mia and The Dark Knight were released. When it comes to product placement in movies, frequent cinema-goers are most likely to respond. In fact, 41% of adults who went to the movies 4 or more times in the last 90 days are classified by the Simmons Movie Product Placement segmentation system as “Emulators,” those consumers who notice, remember and are driven to buy products placed into the context of a film. By comparison, only 28% of consumers who went to a movie only once in the last 90 days are Emulators. Forty-eight percent of Horror film fans say they often pay attention to commercials that show along with movie previews in movie theaters making them the most receptive to cinema advertisements followed by Romantic Comedy fans and Family movie fans. Only 39% of Foreign Language or Independent film fans say they pay attention to such ads. Nearly a quarter of all movie-goers get movie information, reviews or show times online in any given month. Aside from the obvious movie sites, you are likely to find movie information seekers on these sites: Californians like foreign language and independent films, whereas New Englanders have more of a penchant for Comedies and Southerners are among the most likely to see Horror films. Below are the top 5 metro areas for finding adults who say they usually see the three selected movie genres when they go to the theater. One-in-seven American adults tuned into the last Academy Awards® ceremony on ABC, including many non-movie-goers. Nine percent of adults who had not been to the movies even once in the past six months tuned into the last awards show and ultimately comprised 19% of all 2009 Oscar® viewers. Still, the more frequently a consumer goes to the movies, the more likely he or she is to watch the annual Academy Awards® ceremony.

The Simmons Multi-Media Engagement Study is a unique syndicated research program that measures – across multiple dimensions – the relationship between media vehicles and their audiences. This strategic tool provides measures of the cognitive and emotional engagement consumers have with major media properties, which includes broadcast, cable, and syndicated television, major magazines, and Internet sites. The Fall 2009 release of the Simmons Multi-Media Engagement Study utilizes a patented behavioral integration model to map the engagement levels of nearly 800 media vehicle users back to the respondents in the Experian Simmons National Consumer Study, allowing the analysis of media engagement to be filtered by consumer behaviors including users of over 8,000 brands in over 460 product categories. The following slides will demonstrate some powerful examples leveraging the Spring 2009 MME study. Among all U.S. adults, Consumer Reports magazine is the most Trustworthy media vehicle. In fact, 6 of the top 10 Trustworthy media vehicles are print magazines. The other top vehicles include 3 websites and 1 cable television network. When broken down by gender, there are 4 vehicles that remain consistent across the gender breaks, although their rank orders do change. Among media properties that index at 110 or higher for new car intenders*, we can determine which are best for communicating a message of trust. Below are the top vehicles ranked by the percent of new car intenders saying “I trust this to tell the truth.” When ranking print magazines by Ad Attention/Receptivity – the dimension that measures how likely consumers are to notice and pay attention to ads as well as buy advertised products – we find that the top of the list is dominated by niche publications, whose audiences are focused and whose ads are typically targeted. In a similar vein, those magazines that focus on a mass-market audience tend to have the lowest Ad Attention/Receptivity scores. Looking at the statement, “I get valuable information from the ads in this magazine,” we can see some interesting differences between consumers by region. For instance, while American Baby is tops in 3 of the 4 census regions, it is fourth in the Midwest. Smart Money magazine makes the list only in the Northeast and House Beautiful only in the West. Likewise, Family Handyman appears in both the Midwest and South, but not in the Northeast or West. Among print magazines that index at 110 or higher for readers planning to retire in the next year, we can determine which magazines would be ideal for placing ads promoting plans and hobbies for their future free time. The following magazines rank top for future retirees who say “This magazine has ads for things I care about.” The Personal Time Out dimension helps identify vehicles that people like to relax with and to spend their free time using. While there are similarities across users of all ages, these top websites for each age group show that younger users prefer social media and entertainment-oriented sites, while more mature users lean towards lifestyle sites when they just want to kick back. Of the Facebook.com users who say, “I like to kick back and wind down with Facebook.com,” we can look at what retailers they are most likely to shop compared to other online adults. Facebook.com users who like to kick back and wind down on the site are 172% more likely to shop at Express and 130% more likely to shop at Victoria’s Secret or Banana Republic. Should these retailers advertise on Facebook, they could benefit by including messages of escape and time-out. When it comes to word of mouth, synergy is a powerful tool. While 69% of all viewers of The Oprah Winfrey Show say, “This program gives me something to talk about,” this number increases to 81% among those viewers who either read O, The Oprah Magazine or visit Oprah.com. Incredibly, when looking at Oprah viewers who visit her website and also read her magazine, fully 96% say The Oprah Winfrey Show gives them something to talk about, an increase of 39% over all program viewers.