Today, Experian is excited to introduce our Offline Graph as a standalone product that clients can license, marking a significant step in our commitment to powering data-driven advertising through connectivity. Offline Graph empowers advertisers and advertising technology companies to build and refine consumer profiles, contributing to data connectivity, more offline audience reach, and improved offline measurement accuracy.
As a result of consumers engaging with content across more channels, there are more disparate data points than ever before. When you couple that with ongoing signal loss, the need for a unified identity solution has never been greater.
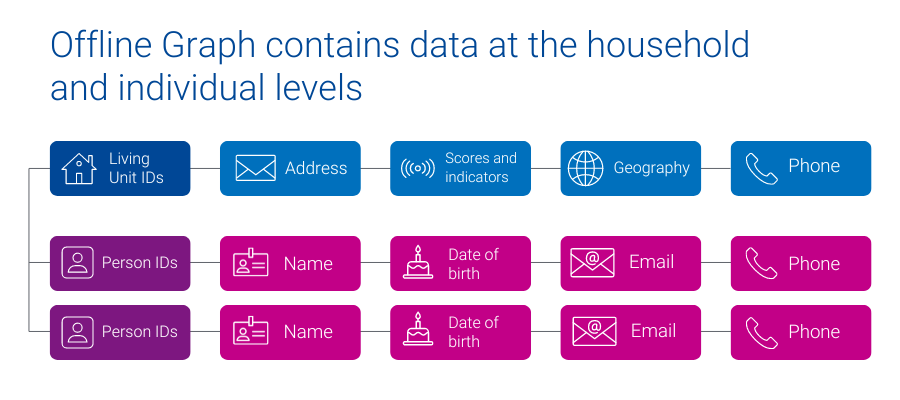
Experian’s Offline Graph offers companies a license of stable offline data points, like name, address, phone number, email, geographic information, date of birth, and additional attributes that provide a complete view of household and individual identities. The Offline Graph integrates known offline identity information from reliable deterministic sources like property ownership records, public records, and marketing data to provide access to all United States consumers and households.
How customers can use the Offline Graph
- A big box retailer fills in the blanks of their existing customer data and builds a database of prospects.
- A media platform more effectively onboards advertisers’ segments, enabling advertisers to reach more of their customers.
- A retail brand better understands their customer’s demographic and behavioral make-up, by licensing Offline Graph with Marketing Attributes.
- A connected TV (CTV) manufacturer increases audience reach and accurately quantifies the campaign impact for their advertising partners.
Experian’s Offline Graph is already driving value across industries. Here’s some in-depth client success stories:
Fusion92 licenses Offline Graph to help their clients transform their marketing
Fusion92 is a marketing partner that fuels business transformation in today’s digital economy and delivers exponential returns for brands.
Fusion92 licenses Experian’s Offline Graph to power their strategy: from research and discovery to audience creation, activation, and measurement. With access to our Offline Graph, Fusion92 ensures their clients get the insights, targeting, reach, and measurement they need to achieve their business goals.
“At Fusion92, we are always pushing the envelope to develop solutions that lead to success for our clients. Our desire to innovate pushed us to find an industry-leading partner in data and identity. This led to us licensing Experian’s Offline Graph product, which we use to build more complete audience profiles for our clients. In doing so, we help brands target, activate, and measure their marketing campaigns more effectively, leading to superior results.”
dave nugent, executive vice president of data and analytics, fusion92
Using Offline Graph to deliver relevant messaging to multiple audience cohorts
A leading direct-to-consumer (DTC) company with strong customer relationships built a robust first-party data set, enabling effective customer retention. To attract new customers, they partnered with Experian to access offline identity data from Experian’s Offline Graph. The Offline Graph provides them with the data needed to validate their first-party data and with the keys to unlock new customers.
With this data, the DTC company delivered the right message to both sets of consumers: existing customers and new prospects. By integrating Experian’s Offline Graph they broadened their reach, personalized their messaging, and improved their marketing.
What sets Experian’s Offline Graph apart from the competition
- Stability of data: With data from deterministic sources, our Offline Graph ensures that your view of consumers – and your ability to connect with them – is stable over time.
- Connected digital and offline data: Seamlessly connect offline data with digital identifiers through our Digital Graph, enabling a holistic approach to marketing, while ensuring consumer privacy is prioritized.
- Tailor made for your use cases: Build the Offline Graph to fit your specific needs, selecting the exact offline identity information required for your campaigns.
- Expanded consumer insights: Connect more data points to enrich your understanding of consumer demographics and behavior, using Experian’s Marketing Attributes and Audiences data.
Offline Graph: Your gateway to consumer connectivity
As signals fade, there is a large emphasis on procuring and having accurate consumer data. Experian’s Offline Graph delivers the connectivity and insights necessary to stay ahead. Whether you aim to strengthen your existing data or access entirely new data sets, Experian’s Offline Graph offers a solution tailored to your needs. Transform your data strategy with Experian’s Offline Graph — your gateway to a unified consumer identity solution.
Latest posts

For British Petroleum (BP), 2010 has been marked by the unfortunate developments resulting after the Deepwater Horizon oil rig explosion in the Gulf of Mexico on April 20. Since then, BP’s crisis mismanagement and failed attempts to stop the oil spill have transformed this unfortunate event into an ecological disaster with political and financial consequences for the company. The oil leak has caused BP to lose a noticeable number of its American customers, namely their most loyal consumers. Experian Simmons DataStream shows that between April 26 and June 28, 2010 the percentage of American adults who report going to BP fell from 26.4% to 16.4%, a relative loss of 38% of their client base in just nine weeks. More astounding is the fact that BP’s most loyal consumers (those who said that BP is the gas or service station that they go to most often) declined a relative 56% during the same time. In fact, on June 28, 2010, only 9.5% of adults went to BP most often compared with 21.5% who were loyal to BP the week of the spill. With the flow of oil temporarily ceased and nearing a permanent solution, BP may finally be able to cap the flow of bad publicity and to reverse some of their loss in market share. Experian Simmons will continue to monitor this and other important consumer trends and share those findings here.