The stakes are high when it comes to advertising during football’s biggest games as the cost of advertising continues to rise, with the average 30-second TV ad during the 2023-24 Sunday Night Football season priced at $882K. With record viewership at the College Football Playoff and the Super Bowl drawing in 123.7 million average viewers, the largest TV audience on record, it’s no surprise that brands are willing to pay those prices since football games are prime time for reaching engaged audiences. In fact, an estimated 51% of viewers search for an ad they saw during the game, underscoring the potential of second-screen engagement to amplify campaign impact. Whether you advertise on TV during these games or not, brands are exploring how they can use football season to drive a deeper connection to their audience. To do this, brands need data driven strategies.
In this blog post, we’ll reveal audience segments designed for you to craft tailored marketing strategies that resonate with football fans in the stands and on the couch. You can find the complete audience segment name in the appendix.
Make a game-winning play with Experian Audiences
With playoff season fast approaching, it’s the perfect time to go on the offensive and target football fans. Utilize Experian’s syndicated audiences to ensure your marketing messages resonate with fans when they’re the most engaged.
- Experian’s 2,400+ syndicated audiences are available directly on over 30 leading television, social, and programmatic advertising platforms.
- Reach consumers based on who they are, where they live, and what they do using data ranked #1 in accuracy by Truthset.
- Run omnichannel campaigns based on a reliable understanding of households, people, digital identifiers, and marketing attributes.
Four football audience categories to add to your advertising lineup
Football fans come in all shapes, sizes, and viewing habits. From dedicated supporters to casual viewers, targeting the right audience can make or break your campaign.
Here are four football audience categories you can target:
- Sports enthusiasts
- College football fans
- 21+ audiences
- TV viewers
Let’s huddle up and break down the audience segments within each category. Whether it’s tailgating, tuning in, or cheering from the stands, these insights will get your campaign into the end zone.
Sports enthusiasts

Whether they’re following their favorite teams, attending games in person, or watching professional sports events on TV, football fans are deeply engaged, making them an ideal target for advertisers looking to score big.
Here are five audiences to target:
- NFL Enthusiasts
- Football (FLA/Fair Lending Friendly)1
- Sports Enthusiasts
- NFL Stadium Visitors
- Professionals Sports Event
College football fans
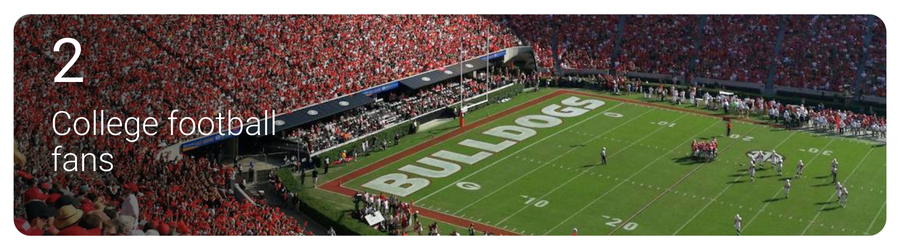
College football fans bring unmatched passion and loyalty, with bowl games during the 2023 season drawing on average of 4.6 million viewers across 40 total games—a 5% increase year-over-year. From students to alumni, these fans represent an invaluable opportunity for advertisers to connect with a deeply invested audience.
Here are four audiences to target to connect with passionate college football fans:
- College Football Stadium Visitors
- College Football Bowls
- College Students
- College Sports Venues
21+ audiences

With 84% of U.S adults reporting that they drink alcohol while watching football on TV, targeting 21+ audiences during game season is a winning play. Whether they’re cracking open a cold one at a tailgate, hosting a game-day party, or relaxing on the couch, these audiences represent a key audience for brands looking to tap into football culture.
Here are four audiences that you can target this post season:
- Imported Light Beer Enthusiasts
- Domestic/Imported Beer
- High-end Spirit Drinkers
- Discretionary spend: Alcohol and wine $331 – $726
These audiences can help you serve up campaigns that pour directly into the heart of football fandom.
TV viewers

Football games attract some of the most engaged and diverse TV audiences, with 85% of sports fans preferring to watch live sports on TV rather than in-person. Notably, for the first time, viewers aged 18 to 49 spent the majority of their sports viewing time (54%) via streaming. This shift highlights the immense opportunity for advertisers to connect with highly attentive viewers tuned into every play.
Here are seven audiences that you can use to create a game-winning strategy to reach engaged TV watching football fans:
- Cable Satellite or Streaming Network Subscribers
- Streaming Video: High Spenders
- Cord Cutters
- Cable and Streaming TV Service Subscribers
- Paid TV High Spenders
- Screen Size – Large
- Co-Watchers
Whether they’re catching the action on a large TV screen or streaming from their phone, these audiences will help you craft campaigns that deliver results with highly engaged viewers.
Score big with Experian this postseason
As some of football’s biggest games approach, it’s time to huddle up and connect with consumers who live for the thrill of the game.Whether they’re tuning in to cheer for their favorite teams, tailgating with friends, or enjoying the game-day experience from home, Experian Marketing Data provides the playbook to score big with targeting, enrichment, and activation. With Experian’s data-driven insights, you can turn every opportunity into a game-winning play!
You can activate our syndicated audiences on-the-shelf of most major platforms. For a full list of Experian’s syndicated audiences and activation destinations, download our syndicated audiences guide.
Explore our other seasonal audiences that you can activate today.
1 “Fair Lending Friendly” indicates data fields that Experian has made available without use of certain demographic attributes that may increase the likelihood of discriminatory practices prohibited by the Fair Housing Act (“FHA”) and Equal Credit Opportunity Act (“ECOA”). These excluded attributes include, but may not be limited to, race, color, religion, national origin, sex, marital status, age, disability, handicap, family status, ancestry, sexual orientation, unfavorable military discharge, and gender. Experian’s provision of Fair Lending Friendly indicators does not constitute legal advice or otherwise assures your compliance with the FHA, ECOA, or any other applicable laws. Clients should seek legal advice with respect to your use of data in connection with lending decisions or application and compliance with applicable laws.
Appendix
Sports enthusiasts
- Lifestyle and Interests (Affinity) > Activities and Entertainment > NFL Enthusiasts
- Lifestyle and Interests (Affinity) > Sports and Recreation > Sports Enthusiast
- Mobile Location Models > Visits > NFL Stadium Visitors
- Lifestyle and Interests (Affinity) > Sports > Football (FLA / Fair Lending Friendly)2 Travel Intent > Activities > Professional Sports Event
College sports fans
- Mobile Location Models > Visits > University Stadium College Football Visitor
- Lifestyle and Interests (Affinity) > Sports > College Football Bowls
- Mobile Location Models > Visits > College Students
- Mobile Location Models > Visits > College Sport Venues
21+ audiences
- Lifestyle and Interests (Affinity) > Activities and Entertainment > Imported Light Beer Enthusiasts
- Lifestyle and Interests (Affinity) > In-Market > Domestic/Imported Beer
- Lifestyle and Interests (Affinity) > Retail > High-end Spirit Drinkers
- Financial – Analytics IQ > Discretionary Spend > Alcohol and Wine: $331-$726
TV viewers
- Television (TV) > Household/Family Viewing > Cable Satellite or Streaming Network Subscribers
- Retail Shoppers: Purchase Based > Entertainment > Streaming/Video/Audio/CTV/Cable TV: Streaming Video: High Spenders
- Television (TV) > Household/Family Viewing > Cord Cutters
- Television (TV) > Household/Family Viewing > Cable and Streaming Service Subscribers
- Television (TV) > TV Enthusiasts > Paid TV High Spenders
- Television (TV) > Viewing Device Type > Screen Size – Large
- Television (TV) > Household/Family Viewing > Co-Watchers
Latest posts

As partnership deals mount, aggressive hiring underway for unified cross-screen technology leaders NEW YORK, July 19, 2016 /PRNewswire/ — Tapad, the leader in cross-device marketing technology and now a part of Experian, has announced plans for aggressive expansion in the Asia Pacific (APAC) region. This move capitalizes on Tapad's exceptional performance for brands and marketing technology companies in North America and Europe. With it's proprietary Tapad Device Graph™, the company will enable global, regional and local clients and partners to understand, monetize and measure marketing to users across screens. The Tapad Device Graph is recognized as the most accurate, scalable cross-screen solution in the market today. The decision to expand into APAC was based on increased demand from global, as well as local, brands and clients, many of which have a strong market presence throughout the region. In addition to expanding its roster of world-class data partners, plans include building a world-class team in Singapore. Over the next few months, Tapad APAC will also establish local entities in additional markets. To accelerate its ramp-up, Tapad APAC is actively recruiting in many areas, ranging from skilled and experienced solutions engineers to seasoned sales and marketing professionals. "Tapad is thrilled to be answering the call for cross-device excellence in APAC," said Pierre Martensson, GM of Tapad APAC. "Our Device Graph is adding millions of devices daily and achieves unmatched levels of scale and accuracy while protecting consumer privacy. This meets a critical need in the region." Tapad appointed Martensson as General Manager of Tapad APAC in May, kicking off expansion in the region. Martensson comes to Tapad with nearly a decade of operations experience throughout APAC, having transformed, developed and grown global organizations. To learn more about partnership and employment opportunities available with Tapad in APAC, visit www.experian.com/careers. Contact us today!
Combined technology gives marketers an enhanced view of the customer for improved planning, targeting and optimization NEW YORK, July 12, 2016/PR Newswire/ - Tapad, the leader in cross-device marketing technology and now a part of Experian, today announced a partnership with Conversion Logic, the martech industry's most accurate unified marketing attribution provider. Conversion Logic will incorporate unified cross-screen data from Tapad's Device Graph™ to identify related devices and media exposures to enhance reporting on the path to conversion. By connecting Conversion Logic's proprietary Ensemble Method, which combines numerous state-of-the-art machine learning algorithms, tuned for each customer use-case for the most accurate results, with Tapad's unified, cross-device technology, marketers will benefit from a highly scientific approach to assessing advertising effectiveness with full, comprehensive customer insights. Linking these technologies will increase marketers' real-time ability to optimize brands' marketing channel spend and creative at a more granular level. During the past six months, Tapad has rapidly grown its data business, doubling the number of companies integrating the Device Graph™ into their platforms and growing the annualized revenue run rate by 210%. Tapad's highly scalable, cross-device data has been confirmed by Nielsen to be very precise. Tapad augments platforms' and publishers' tech stacks with additional scale and relevancy, granting advertisers amplified targeting and analysis options. The growth of the Device GraphTM has allowed Tapad to provide a growing network that benefits all partners with more efficient, effective consumer engagement. "Combining highly accurate data from Tapad with our own user ID technology and understanding how devices may be related at an individual level provides additional visibility into the path to conversion," said Alison Lohse, COO and co-founder of Conversion Logic. "The more we know about the customer journey, the more effective, efficient and customized marketers can be with marketing efforts. With Tapad, we have achieved a unified customer view that helps us piece together the purchase journey while preserving proven accuracy." "Conversion Logic's Ensemble Method delivers singularly customized and precise results that are not just accurate, but actionable," said Dave Fall, COO of Tapad. "The combination of powerful technology and a user-friendly interface, plus Tapad's ability to only consider relevant and scalable components in the marketplace, creates a more concentrated and beneficial environment for both its partners and clients." Contact us today!
B2B marketers can now deliver the right message to the right user at the right time across devices and channels NEW YORK, NY–(Marketwired – Jun 1, 2016) – Madison Logic, one of the world's fastest growing companies dedicated to solving the digital needs of B2B marketers, is partnering with Tapad, the leading provider of unified and now a part of Experian, cross-screen marketing technology solutions. Now business-to-business (B2B) marketers can power targeted advertising and content syndication programs across all channels, including smartphones, computers and tablets. The increasing shift in content consumption across mobile devices makes cross-device identification and attribution a top priority for B2B marketers. The Madison Logic and Tapad partnership gives B2B marketers unprecedented reach and scale with the ability to run always-on, cross-device, account-based marketing programs targeting decision makers who are actively researching similar products and services. "Screens are everywhere and so is the B2B buyer," said Vin Turk, SVP of Audience Development for Madison Logic. "This partnership allows marketers to harness the power of Madison Logic's intent data and combine it with Tapad's cross-device solutions to connect with the most-likely-to-convert prospects with hyper-relevant content wherever and whenever they're doing their research." "Relevance is essential to the success of B2B marketers, particularly now, when breaking through the clutter is difficult," said Dave Fall, COO of Tapad. "This partnership with Madison Logic allows marketers to leverage their existing customers while identifying and reaching new audiences with messaging tailored to every device." For more information about Madison Logic's account-based marketing platform, please visit https://www.madisonlogic.com/account-based-marketing/. For more information about Tapad's cross-platform advertising solutions, please visit https://www.experian.com/marketing/consumer-sync. Contact us today!