Loading...

How Cuebiq increased match rates amidst signal loss using Activity Feed

Published: June 26, 2024 by Lucy Simmonds

Cuebiq used Experian’s Activity Feed to resolve digital ad exposures to in-store purchases so that marketers could know the effectiveness of their clients’ media campaigns.

Cuebiq’s mission, as an offline intelligence and measurement company, is to deliver the most accurate and reliable insights on how digital marketing efforts impact offline consumer behavior. This case study shows how Cuebiq, despite signal loss, partnered with Experian to continue delivering in-store lift analyses. To achieve this, Cuebiq used Experian’s Activity Feed to resolve digital ad exposures to in-store purchases, so that marketers could know the effectiveness of their clients’ media campaigns.

Activity Feed helped Cuebiq increase its match rates by using all the identifiers supported in Experian’s signal-agnostic Digital Graph, reducing its reliance on third-party cookies. By partnering with Experian, Cuebiq could help their clients, marketers, more accurately measure their campaigns and optimize their media.

What is Activity Feed?

Experian’s Activity Feed pulls together fragmented digital event data from all digital channels, including browsers like Safari and Firefox that restrict traditional tracking methods. Activity Feed ingests and ties this digital ad exposure data to household or individual profiles hourly, helping clients associate that data to offline purchase activity made by that household or individual. Activity Feed plays a crucial role in overcoming fragmented data and helping marketers accurately measure their cross-channel marketing efforts.

Challenge: Increasing match rates across digital platforms

Cuebiq wanted to enhance how well they connect digital ad exposures, across web, mobile and connected TV (CTV) to specific mobile ad IDs (MAIDs), of those who visited clients’ stores. They needed a single technology partner who could collect data across these environments and improve these connections, especially as iOS updates, like iOS 14.5, posed potential challenges.

With the ability to resolve exposures to households, individuals, and MAIDs to then facilitate attribution of digital exposures to offline store visitation, Cuebiq could continue to provide accurate reports on how online ads impact offline consumer behavior. This clarity in data enables their clients to fine-tune their marketing strategies.

Cuebiq’s key objectives included:

  • Resolving digital exposures to MAIDs
  • Increasing overlap of offline and online data  
  • Improving the effectiveness of offline measurement offerings

Activity Feed: The solution to increase match rates

Cuebiq used Activity Feed to resolve data from cookieless environments like Safari to a single household or individual and saw significantly higher match rates. Cuebiq was able to track cross-channel media exposures, resolve them to MAIDs, and then use the Activity Feed output to correlate in-store visitation and sales to their clients’ media campaigns. Cuebiq also implemented the Experian pixel, which they placed to track all their marketers’ impressions (mobile, CTV, web traffic, etc.). The Experian pixel collects information in real-time, such as:

  • Timestamp
  • Cookies
  • Device ID (MAID/CTV) when available
  • IP address
  • User-Agent
  • Impression ID

“Before we started working with Experian, we couldn’t fully maximize ad views across the complex digital landscape. In just a few weeks, they were able to maximize the match rate across the fragmented digital inventory, solving a huge problem when it comes to cross-channel attribution.”

Luca Bocchiardi, Director of Product, Cuebiq

Results

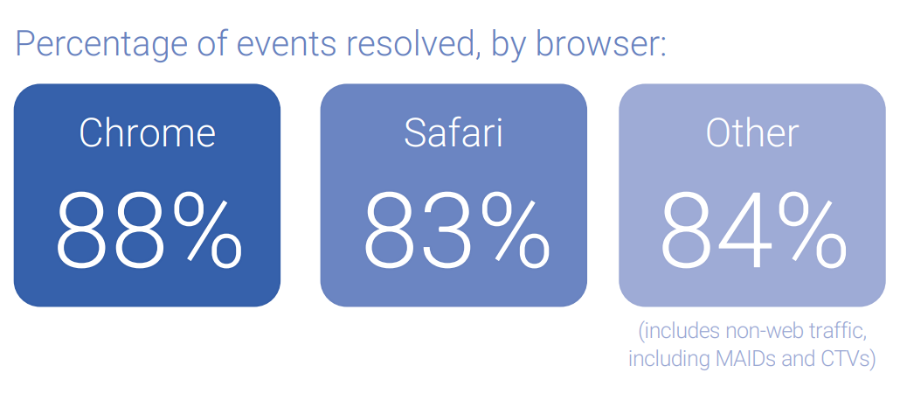
Activity Feed combines separate data streams and matches them back to a household. This enables Cuebiq to expand household IDs and accurately identify MAIDs that are seen in-store for cross-channel measurement. Over a 21-day period, Cuebiq passed ~1 billion events to Experian. Activity Feed resolved 85% of total events to a household, 91% of which were tied to MAIDs.

Percentage of events resolved by browser:  

Chrome: 88%  

Safari: 83%  

Other (including non-web traffic, including MAIDs and CTVs): 84%  

By implementing Activity Feed, Cuebiq was successfully able to:

  • Gain clearer insights into the success of their client‘s campaigns
  • Match consumer engagements in a privacy-compliant manner
  • Tell the story of the key performance indicators (KPIs) related to their marketing efforts

Prepare for a cookieless future with higher match rates

Activity Feed is prepared for a cookieless future and uses alternative IDs, like ID5 IDs, hashed emails, and IPs for identity resolution, ensuring no reliance on third-party cookies. Experian remains fully committed to exploring a suite of next-generation solutions and prioritizing continued testing of different industry solutions, including the Google Privacy Sandbox, to help customers prepare for a future without cookies. We’ve identified six viable alternatives to third-party cookies, how these alternatives fall short, and how Experian can help you navigate these alternatives.

“Experian’s customer service is extremely efficient and collaborative. We trust them to keep putting our business first long-term.”

Luca Bocchiardi, Director of Product, Cuebiq

Download the full case study to discover how Cuebiq used Activity Feed to overcome their challenges. Your path to maximizing match rates and resolving data from cookieless environments starts here.


About Cuebiq

Cuebiq is transforming the way businesses interact with mobility data to providing a high-quality and transparent currency to map and measure offline behavior. They are at the forefront of all industry privacy standards, establishing an industry-leading data collection framework, and making it safe and easy for businesses to use location data for innovation and growth.

To learn more, visit their website at www.cuebiq.com


Latest posts

Loading…
Amazon Prime Day: a huge success

To say that Amazon Prime Day was a raging success is a considerable understatement Prime Day, the manufactured holiday by Amazon.com to mark the site’s 20th anniversary on July 15, 2015, was the biggest day of the past year for Amazon.com…by far. Experian Marketing Services’ Hitwise® online intelligence tool reports that Amazon.com garnered over 83.3 million visits from mobile and desktop browsers on Prime Day. By comparison, Prime Day topped Cyber Monday — the previous record holder — by a staggering 51.5 percent and Black Friday by 77.2 percent. It’s actually a bit ironic that Amazon promoted Prime Day as having more deals that Black Friday. That’s because visits to Amazon.com have actually been growing so steadily that last year’s Black Friday isn’t even among the site’s 10 biggest traffic days of the last 12 months. Nearly half of the days in July this year, in fact, have had visit counts that surpassed Black Friday. Compared to the previous Wednesday (July 8), the number of visits to Amazon.com on Prime Day rose 68 percent. But Amazon wasn’t the only retailer celebrating. Prime Day was definitely more of a “a rising tide lifts all boats” kind of event. For instance, 57 of the top 100 retail sites in the Hitwise 500 also saw increased visits on July 15 compared to the Wednesday prior. Walmart and Best Buy, which offered competing deals, had a an especially strong showing on Prime Day with visits to their sites up 97 percent and 44 percent, respectively, over the previous Wednesday. Search on Amazon Prime Day So what deals were consumers flocking to Amazon.com to take advantage of? To find out, I used Hitwise to compare the search terms leading to Amazon on Prime Day compared to the previous Wednesday. No surprise, many of the products that had the greatest increase in search click share week-over-week were Amazon’s own, including the “Amazon Fire Stick” (+417 percent) and “echo” (+357 percent). But also on the list were other products that were part of Amazon’s celebratory deals, such as “Nexus 6” (+352 percent), “Instant Pot” (+271 percent) and “PS4” (+250 percent). Overall, searches for Amazon Prime Day and variations thereof were common on July 15 and Amazon.com received 59.8 percent of search clicks from “Amazon Prime Day” searches, 61.2 percent of which were paid, meaning Amazon invested heavily in making sure that it successfully captured the traffic of interested consumers. But obviously not all Prime Day searches lead to the retail giant. Media sites Wired, CNNMoney.com and NBC News each captured at least three percent of traffic following a Prime Day search. In fact, seven of the top 10 winners of “Amazon Prime Day” searches were news and media outlets, which largely did not invest in paid search for that term. Walmart, which captured 1.5 percent of “Amazon Prime Day” searches, however, did pay. Among the “Amazon Prime Day” search clicks that lead to Walmart.com, 63.6 percent were paid. Of course two can play at that game. Amazon was also busy buying search terms of competitors on Prime Day. For instance, 23.9 percent of the clicks to Amazon from searches for “Target” were paid as were 15.9 percent of “Newegg” search clicks, eight percent of search clicks from “Best Buy” searches and 2.5 percent of search clicks for “Walmart.” Sources of traffic In terms of sources of traffic to Amazon.com, News and Media sites accounted for a 56 percent greater share of upstream traffic on Prime Day (6.7 percent) than the previous Wednesday (4.3 percent). But media weren’t the only ones talking about Prime Day, consumers, too, were taking to social media to chat up the event. And while not all online chatter was positive, Social Media sites delivered 15.2 percent of all referred traffic to Amazon.com on Prime Day, up from 11.3 percent of traffic the Wednesday prior, a relative increase of 35 percent. Despite the fact that Prime Day was meant to celebrate a milestone anniversary for Amazon, the overwhelming success for Amazon and other retailers will likely make it an annual event. If that is indeed the case, consumers will come to anticipate the day much like they do Black Friday. Marketers shouldn’t discount the potential for an annual Prime Day event to disrupt normal consumer spending patterns as well as drive even more dollars to be spent through online channels. For more information on how you can leverage Hitwise, the world’s largest sample of online consumer behavior, to improve the effectiveness of your search, display, affiliate, mobile, email and social media marketing campaigns, click here.

Jul 17,2015 by

Blazing new trails in measurement science

Pat Pellegrini is General Manager for Experian Marketing Services’ Consumer Insights group in North America. He also serves as Chief Research Officer and strongly supports the important role that high quality measurement science plays in driving deeper, more actionable consumer understanding. Every year, the American Association for Public Opinion Research (AAPOR) holds its annual conference where research professionals gather to discuss the latest trends, innovations and research. As a leading provider of consumer insights, Experian Marketing Services has an important role to play within AAPOR, the top professional organization of public opinion and survey research professionals. Since joining Experian as Chief Research Officer, and now as General Manager of Consumer Insights, I have driven our organization — already known for our trusted consumer insights — to move even more aggressively on innovations in measurement science, whether that is through self-reported consumer surveys like our Simmons National Consumer Study or passive data collection like our Hitwise online intelligence data. Consumers are being profoundly affected by rapid changes in technology and we are committed to being at the forefront in developing new research approaches to ensure that our data accurately and reliably reflects consumer decisions, behaviors, attitudes, lifestyles and media preferences. Experian Marketing Services was well represented at this year’s AAPOR conference both among attendees and presenters. In fact, six exciting topics from Experian were presented at the conference based on the work we do here every single day. Having this level of recognition from our research peers and the AAPOR organization is an outstanding accomplishment that speaks to our commitment toward research quality and innovation. It’s these types of insights that will help propel the industry forward. At the conference, I was delighted to present, along with my colleague Gerry Dirksz, findings from a successful initiative that Experian Marketing Services recently undertook to produce higher response rates to our Simmons National Consumer Study. Declining response rates are an obstacle facing nearly every player in our field and one that has real implications on data quality. Because certain key segments of the population (e.g., Millennials, Hispanics, etc.) are disproportionately less likely to respond to or participate in research studies, marketers and others who rely on such research may be handicapped by potential blind spots in the resulting data which prevent them from fully understanding important consumer audiences. To prevent such blind spots from occurring in our data, we tested a new two-phased dynamic incentive program that took into consideration an individual household or specific respondent’s propensity to fall into certain “hard-to-reach” segments. With this information in hand, we were able to offer different (often higher) incentives to “hard-to-reach” respondents from the start in order to improve response rates of those segments. Compared to control groups, response rates among those whose incentives were determined by the dynamic model were significantly higher. Having now rolled out this successful process for our entire sample frame, we have seen overall response rates improve markedly. While Experian is not alone in testing new initiatives like these, we are most definitely pioneers in the space and are setting an example for others to follow now that we have demonstrated results. In this regard, I look forward to blazing new trails based on well-thought hypotheses from our expert team. This will ensure that our data continues to be the gold-standard for helping our clients better understand consumers so that they can create more relevant and engaging interactions. Other topics presented by Experian at AAPOR include: The effects of total navigational burden, length of instrument and page complexity on item non-response This paper examined item non-response for long surveys which is a major topic of concern for survey researchers, particularly those looking to collect a large number of measurements from a single source. Specifically, binary (yes/no) questions were studied and potential factors that might contribute to item non-response were identified for further exploration. Patterns of response and non-response to sexual orientation measures In this presentation, relationships and patterns of item non-response among non-Hispanics to a measure of sexual orientation contained within the Simmons National Consumer Survey were explored. Since 2009, item non-response to the sexual orientation question has declined by a rate of 26 percent with a decline among 18-34 year-old respondents of 43 percent. U.S. Hispanic receptivity to self-reported measure of sexual orientation This paper examined the effects of adding a question on sexual orientation with respect to mail survey instrument return rates and item non-response rates among the U.S. Hispanic population.  A key finding from this research was the pronounced, significant difference in item non-response rates which were disproportionately higher for Hispanics compared to non-Hispanics and significantly higher for Spanish-language Hispanics versus English-language Hispanics. Does providing an email address in an initial contact study indicate respondents will be cooperators in a subsequent online panel study? This study examines how the cooperation rate for a future study differs between individuals who are willing to provide an email address in the initial phase and those who are not. Results indicate that respondents who provide an email address in the initial contact study are more cooperative in joining a subsequent online panel than those who do not provide an email address. Patterns of non-response to health, diet, nutrition and apparel measures conditioned on body mass index This study examines the relative response of overweight or obese individuals to questions concerning diet, nutrition, health and even apparel in comparison to those individuals classified in the normal range for BMI. Based on our findings, a BMI measurement, outside of the normal range, would not negatively impact a study’s non-response rate to other survey questions related to one’s self-image. For more information about these presentations, please contact us at consumerinsight@experian.com.

Jun 11,2015 by

No more words: The rise of animated GIFs

In case you missed it, Facebook recently announced that it would begin supporting animated GIF images and GIF-fanatics everywhere went: The decision by Facebook, which is rather late to the GIF party given that animated GIFs are already commonly used on sites like Tumblr, Reddit, Twitter, Imgur, BuzzFeed and more, virtually guarantees that animated GIFs will soon be commonplace (like it or not) for nearly everyone. It may even give Facebook an opportunity to re-engage Millennials who already frequently communicate using stickers, emoji, emoticons and animated GIFs. To make use of the new feature right away, Facebook users will need to paste a link to an existing GIF into their status update box. Users who have the “auto-play” setting activated will see GIFs posted by their Facebook friends looping through the animation automatically as they scroll through their news feed or a friend’s timeline. For the time being, at least, users are not allowed to upload GIFs to Facebook. While Facebook has not yet allowed animated GIFs to be used by Page operators, there’s still a huge opportunity for marketers in this move. That’s because marketers can still create their own clever animated GIFs hosted away from Facebook either on their own website or through partnerships with sites like Giphy — which already has a Facebook Messenger add-on. They can then encourage consumers to say what’s on their mind — via Facebook, text/chat, Twitter, etc. — using their branded animated GIFs instead of words. Subway, for instance, has a set of GIFs in Giphy that allow consumers to say they’re hungry by sending GIFs of animated sub sandwiches and people eating them to others. And Experian Marketing Services found that users of animated GIFs are hungry for branded content. In fact, they’re already seeking out branded GIFs to share in this way. Media and entertainment brands, of course, have a natural play in the animated GIF space since they already have content developed. They merely need to convert it into a few seconds of animation and fans of the show, movie, game, musician, etc. will take it and run. But even for marketers who don’t have existing content, animated GIFs present an option for producing rich (if not always the highest quality), engaging visual content that’s more affordable than video but a step up from fixed images. They also present on-the-go consumers who are increasingly looking for shorter more “snackable” content with a quick way to engage with a brand when they don’t have the time or interest in watching an actual video. To help marketers test the waters and create relevant GIFs, we looked at online search variations of “GIF” during the 12 weeks ending May 30, 2015 using our Hitwise® online intelligence platform. Some of the top variations and a few popular GIFs in each category are below. Funny GIFs: Animated GIFs are often used to put a smile on people’s face, so it’s no wonder that “funny” GIFs are the most commonly sought out. Babies and cats feature prominently in this category. Reaction GIFs: Among users, animated GIFs are a natural way to react to something a friend has said or shared. Reactions can run the gamut of emotions from “meh” to “oh no you didn’t.” Happy Birthday GIFs: Want your Happy Birthday wishes to be memorable and unique. Don’t say it with words; say it with an animated GIF! Does your brand play a role in helping people celebrate their birthday? Then why not help people say it as well. Crying GIFs: That teary emoji can only express so much emotional depth. Show you know how someone really feels with a crying animated GIF instead.   Mind blown GIFs: Saying “OMG” is so yesterday. Why would anyone just tell someone they blew your mind when they can show them? No wonder “mind blown” animated GIFs are among the most commonly sought out. Source: Experian Marketing Services It’s still early days for animated GIFs in Facebook, but the opening of the door by the social media giant could prove to be the tipping point in the mass adoption of this medium that lies somewhere between an image and a video. In fact, animated GIFs may eventually prove so popular that consumers may come to expect and prefer them over non-animated content. For more information about how Experian Marketing Services can provide marketers with insights into the types of GIFs consumers are looking for, click here.

Jun 04,2015 by

Subscribe to our newsletter

Enter your name and email for the latest updates

This site is protected by reCAPTCHA and the Google Privacy Policy and Terms of Service apply.

About Experian Marketing Services

At Experian Marketing Services, we use data and insights to help brands have more meaningful interactions with people. As leaders in the evolution of the advertising landscape, Experian Marketing Services can help you identify your customers and the right potential customers, uncover the most appropriate communication channels, develop messages that resonate, and measure the effectiveness of marketing activities and campaigns.

Visit our website

Subscribe to our newsletter

Stay up to date on the latest industry news and receive expert tips from our marketing experts.
Subscribe now!