Today, Experian is excited to introduce our Offline Graph as a standalone product that clients can license, marking a significant step in our commitment to powering data-driven advertising through connectivity. Offline Graph empowers advertisers and advertising technology companies to build and refine consumer profiles, contributing to data connectivity, more offline audience reach, and improved offline measurement accuracy.
As a result of consumers engaging with content across more channels, there are more disparate data points than ever before. When you couple that with ongoing signal loss, the need for a unified identity solution has never been greater.
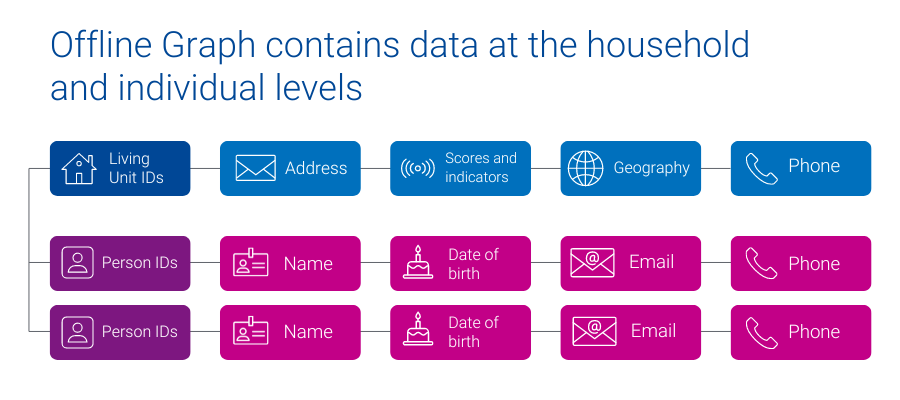
Experian’s Offline Graph offers companies a license of stable offline data points, like name, address, phone number, email, geographic information, date of birth, and additional attributes that provide a complete view of household and individual identities. The Offline Graph integrates known offline identity information from reliable deterministic sources like property ownership records, public records, and marketing data to provide access to all United States consumers and households.
How customers can use the Offline Graph
- A big box retailer fills in the blanks of their existing customer data and builds a database of prospects.
- A media platform more effectively onboards advertisers’ segments, enabling advertisers to reach more of their customers.
- A retail brand better understands their customer’s demographic and behavioral make-up, by licensing Offline Graph with Marketing Attributes.
- A connected TV (CTV) manufacturer increases audience reach and accurately quantifies the campaign impact for their advertising partners.
Experian’s Offline Graph is already driving value across industries. Here’s some in-depth client success stories:
Fusion92 licenses Offline Graph to help their clients transform their marketing
Fusion92 is a marketing partner that fuels business transformation in today’s digital economy and delivers exponential returns for brands.
Fusion92 licenses Experian’s Offline Graph to power their strategy: from research and discovery to audience creation, activation, and measurement. With access to our Offline Graph, Fusion92 ensures their clients get the insights, targeting, reach, and measurement they need to achieve their business goals.
“At Fusion92, we are always pushing the envelope to develop solutions that lead to success for our clients. Our desire to innovate pushed us to find an industry-leading partner in data and identity. This led to us licensing Experian’s Offline Graph product, which we use to build more complete audience profiles for our clients. In doing so, we help brands target, activate, and measure their marketing campaigns more effectively, leading to superior results.”
dave nugent, executive vice president of data and analytics, fusion92
Using Offline Graph to deliver relevant messaging to multiple audience cohorts
A leading direct-to-consumer (DTC) company with strong customer relationships built a robust first-party data set, enabling effective customer retention. To attract new customers, they partnered with Experian to access offline identity data from Experian’s Offline Graph. The Offline Graph provides them with the data needed to validate their first-party data and with the keys to unlock new customers.
With this data, the DTC company delivered the right message to both sets of consumers: existing customers and new prospects. By integrating Experian’s Offline Graph they broadened their reach, personalized their messaging, and improved their marketing.
What sets Experian’s Offline Graph apart from the competition
- Stability of data: With data from deterministic sources, our Offline Graph ensures that your view of consumers – and your ability to connect with them – is stable over time.
- Connected digital and offline data: Seamlessly connect offline data with digital identifiers through our Digital Graph, enabling a holistic approach to marketing, while ensuring consumer privacy is prioritized.
- Tailor made for your use cases: Build the Offline Graph to fit your specific needs, selecting the exact offline identity information required for your campaigns.
- Expanded consumer insights: Connect more data points to enrich your understanding of consumer demographics and behavior, using Experian’s Marketing Attributes and Audiences data.
Offline Graph: Your gateway to consumer connectivity
As signals fade, there is a large emphasis on procuring and having accurate consumer data. Experian’s Offline Graph delivers the connectivity and insights necessary to stay ahead. Whether you aim to strengthen your existing data or access entirely new data sets, Experian’s Offline Graph offers a solution tailored to your needs. Transform your data strategy with Experian’s Offline Graph — your gateway to a unified consumer identity solution.
Latest posts

We asked the experts about hashed email. What is email hashing? Do we need to hash email addresses in databases? What can we expect for hashed identifiers?

While the weather outside is frightfully hot this summer, it’s never too soon to start thinking about the holidays – and consumers are more likely to start their holiday shopping early this year. To get you ready for the 2022 holiday shopping season, we looked back at consumer shopping trends from 2019-2021. What did we learn and what trends do we expect to see this year? Let’s look back. A look back Over the last three years, average consumer spending has increased. Record 2021 holiday sales came amidst a wave of COVID-19 cases, rising inflation, labor shortages, and supply chain problems. Despite these challenges, consumers continued to let it snow when it came to spending during the holiday season. 2022 has been a year with its own economic roadblocks – the war in Ukraine, rising gas prices, and recession concerns. Yet 2021 was a banner year for holiday sales despite its obstacles, and we predict similar trends in the 2022 holiday shopping season. What trends do we expect to see for the most wonderful time of the year? 2022 predictions While consumer spending remains strong, changing economic conditions continue to shape shopper behavior. To develop our predictions for 2022 holiday shopper behavior, we focused on four key areas: When consumers shop Where consumers shop What consumers purchase Consumer media preferences Now, let's make our holiday campaign planning checklist and check it twice. When consumers shop Chestnuts roasting on an open fire. Jack Frost nipping at your nose. Those aren’t the only ways to know when the holiday season has begun. Shoppers tend to spread out their holiday purchases across multiple months and were more likely to start shopping earlier. To understand holiday retail sales trends from 2019-2021, we identified four shopper segments: Early Shoppers Traditional Shoppers Late Shoppers Random Shoppers What differences did we see between our four shopper segments? Early shoppers made almost half of their holiday purchases in October Random shoppers spread out their holiday purchases evenly across multiple months Late shoppers made almost half of their holiday purchases in December Traditional shoppers made almost half of their holiday purchases in November While December continues to dominate holiday sales, October has started to gain traction over the last three years, and November remains a core shopping month. Everybody knows a turkey and a mistletoe help to make the season bright but knowing when your consumers are most likely to shop will help deck your campaign planning halls. Jingle bell rock your way to holiday sales that shine bright with our tips to prepare for earlier shoppers: Offer targeted promotions earlier in the shopping season Target your ads based on the shopping habits of your customers throughout the season Where consumers shop There’s no place like home for the holidays but most consumers aren’t shopping from home. Despite the rise in online shopping, brick and mortar locations continue to dominate holiday sales. October is the most popular month to take a one-horse open sleigh to a store, and consumers gather around the fire to online shop in November and December. With most shoppers preferring to shop in-store, and e-commerce popularity growing, it’s critical to think about bridging the gap between your online and offline presence for the consumer. Are you offering multiple paths to purchase with solutions such as BOPIS (Buy Online, Pickup In-Store)? Go down in history like Rudolph with our tips to prepare for more in-store shopping: Focus on in-store shopping experience technology (self-checkout, VR, QR codes, scan to pay, etc.) Offer multiple paths to purchase to connect your online and physical presence through methods such as BOPIS (Buy Online, Pickup In-Store), BORIS (Buy Online, Return In-Store), and ROPO (Research Online, Purchase Offline), etc. What consumers purchase When it comes to holiday gifts, for some, only a hippopotamus will do. Compared to pre-pandemic, shoppers are spending more at apparel stores and mass retailers. Spending at specialty retailers, warehouse clubs, and on office, electronic, and games is almost the same across holiday and non-holiday shopping months. Time for toys and time for cheer may be year-round, but are there any correlations between where consumers shop (online vs. in-store) and what they purchase? Our data found that shoppers who bought from mass retailers were more likely to shop online, while shopping for apparel and warehouse clubs was done at a physical store location. Put this insight to the test by thinking through how you can target your consumer based on where they shop in-store and online. You just might find that hippopotamus at a brick and mortar mass retailer location! Consumer media preferences Do you see what I see? While we are seeing a shift to digital media channel preference, consumers still engage with traditional media channels like direct mail and the traditional newspaper. Successfully connecting with your customers involves capturing their attention through the right channel. We found that our four shopping groups prefer a mix of traditional and digital media channels. What does your media channel mix look like? Hark! The herald angels sing of ways to adapt to the change in holiday spend and media preferences: Align your activation efforts to digital, but don't forget about traditional channels Expand your targeting and activation focus beyond in-store vs. online Download our new 2024 report For a deeper dive into our predictions and actionable insights you can use to take your holiday campaign planning home for the holidays, download our new 2024 report. Experian data can help you refine your content and creative strategy to achieve maximum ROI for each campaign across all your channels. Download now

Fluctuation in consumers' behaviors and preferences during the pandemic has prompted a shift in the practices and patterns that we are accustomed to. Powerful market forces are emerging as society builds a new normal, forcing marketers to rethink their strategy, activation, and measurement. It is important for marketers to understand the forces that influence the industry, and to learn about alternative approaches that can be applied to help reach their goals. In our recent webinar, ‘How to Adjust to the New World of Advertising,’ Experian’s Chris Feo and guest speaker Tina Moffett, Principal Analyst at Forrester Research, lead an in-depth discussion of the market dynamics and developments guiding us to this new era of advertising. They talked about: The pandemic changing consumer behavior Emerging media channels Data deprecation The pandemic and increased media consumption The pandemic caused seismic shifts in consumer behaviors and business operations. Work from home became the norm, consumers made drastic changes in their routines, and businesses had to adjust to new operating models as local economies shrank and supply chains strained. As stay-at-home orders were put into effect, consumers increased their media consumption drastically as more time was spent at home in front of their devices. According to Forrester, by June 2020, 48% of US online adults subscribed to at least one streaming service, while 34% had signed up for multiple. Forrester contends that: Social and online video/OTT will grow fastest among other categories of ad spend Connected TV outpaces other video advertising channels 55% of consumers plan to continue watching movies at home rather than in theatres after the pandemic Data deprecation The ways that marketers can personalize content and measure the effectiveness of campaigns is changing with data deprecation. Consumer preferences, regulations, and technology providers are evolving the way advertisers understand consumers, causing changes to existing identity-based marketing strategies. According to Forrester, 66% of marketers are investing in first-party data collection strategies to adapt to these market forces. Marketers need to adjust Demand for a new advertising approach Changes in consumer behavior, evolving media consumption patterns, and data deprecation have marketers looking at new approaches to targeting and measurement. However, with the future uncertain in many of these areas, marketers need to test and experiment to determine which approach is best for them in particular use cases. Shifting to a new world of experimentation Advertisers need to start by assessing their current environment to determine where they have exposure today, which methods of identification they are using, and how those channels may be impacted by the market forces outlined earlier. From there, they need to start asking themselves how they can assess identity in the future or if there is another way to approach advertising in that specific channel. There are specific areas where marketers can look to make investments in terms of experimentation: Adoption of cleanrooms to support analytics and audience targeting Investment in first-party data to overcome the issue of data deprecation Shifting to a value-based, omni-channel advertising mindset to address customers’ needs Investment in data-savvy resources to manage media insights Adoption of consistent cross-platform advertising metrics and currencies to inform better planning If you missed our recent webinar ‘How to Adjust to the New World of Advertising,’ you can listen to the full discussion here.