
Today, Experian is excited to introduce our Offline Graph as a standalone product that clients can license, marking a significant step in our commitment to powering data-driven advertising through connectivity. Offline Graph empowers advertisers and advertising technology companies to build and refine consumer profiles, contributing to data connectivity, more offline audience reach, and improved offline measurement accuracy.
As a result of consumers engaging with content across more channels, there are more disparate data points than ever before. When you couple that with ongoing signal loss, the need for a unified identity solution has never been greater.
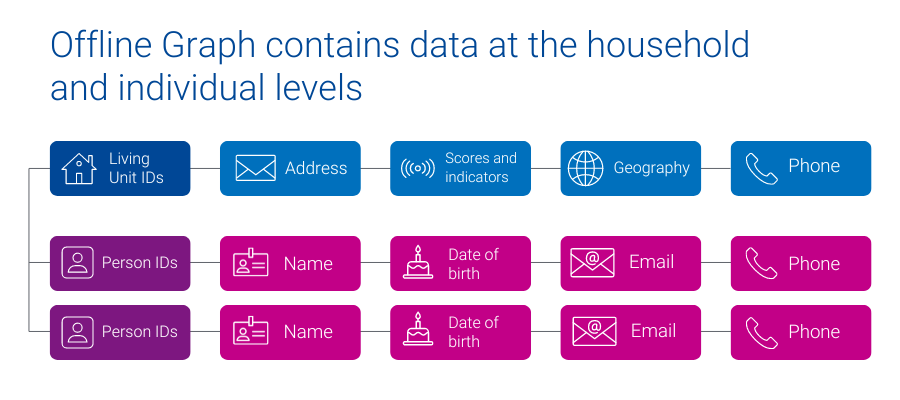
Experian’s Offline Graph offers companies a license of stable offline data points, like name, address, phone number, email, geographic information, date of birth, and additional attributes that provide a complete view of household and individual identities. The Offline Graph integrates known offline identity information from reliable deterministic sources like property ownership records, public records, and marketing data to provide access to all United States consumers and households.
How customers can use the Offline Graph
- A big box retailer fills in the blanks of their existing customer data and builds a database of prospects.
- A media platform more effectively onboards advertisers’ segments, enabling advertisers to reach more of their customers.
- A retail brand better understands their customer’s demographic and behavioral make-up, by licensing Offline Graph with Marketing Attributes.
- A connected TV (CTV) manufacturer increases audience reach and accurately quantifies the campaign impact for their advertising partners.
Experian’s Offline Graph is already driving value across industries. Here’s some in-depth client success stories:
Fusion92 licenses Offline Graph to help their clients transform their marketing
Fusion92 is a marketing partner that fuels business transformation in today’s digital economy and delivers exponential returns for brands.
Fusion92 licenses Experian’s Offline Graph to power their strategy: from research and discovery to audience creation, activation, and measurement. With access to our Offline Graph, Fusion92 ensures their clients get the insights, targeting, reach, and measurement they need to achieve their business goals.
“At Fusion92, we are always pushing the envelope to develop solutions that lead to success for our clients. Our desire to innovate pushed us to find an industry-leading partner in data and identity. This led to us licensing Experian’s Offline Graph product, which we use to build more complete audience profiles for our clients. In doing so, we help brands target, activate, and measure their marketing campaigns more effectively, leading to superior results.”
dave nugent, executive vice president of data and analytics, fusion92
Using Offline Graph to deliver relevant messaging to multiple audience cohorts
A leading direct-to-consumer (DTC) company with strong customer relationships built a robust first-party data set, enabling effective customer retention. To attract new customers, they partnered with Experian to access offline identity data from Experian’s Offline Graph. The Offline Graph provides them with the data needed to validate their first-party data and with the keys to unlock new customers.
With this data, the DTC company delivered the right message to both sets of consumers: existing customers and new prospects. By integrating Experian’s Offline Graph they broadened their reach, personalized their messaging, and improved their marketing.
What sets Experian’s Offline Graph apart from the competition
- Stability of data: With data from deterministic sources, our Offline Graph ensures that your view of consumers – and your ability to connect with them – is stable over time.
- Connected digital and offline data: Seamlessly connect offline data with digital identifiers through our Digital Graph, enabling a holistic approach to marketing, while ensuring consumer privacy is prioritized.
- Tailor made for your use cases: Build the Offline Graph to fit your specific needs, selecting the exact offline identity information required for your campaigns.
- Expanded consumer insights: Connect more data points to enrich your understanding of consumer demographics and behavior, using Experian’s Marketing Attributes and Audiences data.
Offline Graph: Your gateway to consumer connectivity
As signals fade, there is a large emphasis on procuring and having accurate consumer data. Experian’s Offline Graph delivers the connectivity and insights necessary to stay ahead. Whether you aim to strengthen your existing data or access entirely new data sets, Experian’s Offline Graph offers a solution tailored to your needs. Transform your data strategy with Experian’s Offline Graph — your gateway to a unified consumer identity solution.
Latest posts

London – 24 November, 2017 – Tapad, part of Experian, is the leader in cross-device marketing technology and continues to broaden its reach across EMEA. The business today reported a 20 percent growth in the scope of its regional device graph, a data set used by organisations to map consumers to their devices, enabling better, more personalised cross-device marketing. This news complements Tapad’s recent expansion of its UK team with the hire of experienced solutions engineer, Davide Rosamilia. As the demand for cross-device technology solutions continues to grow around the globe, coupled with the emergence of regulations such as Europe’s General Data Protection Regulation (GDPR), Tapad is committed to offering suppliers the greatest level of insight without compromising consumer privacy. Since Tapad started licensing its proprietary Tapad Device GraphTM just over a year ago, demand for the company’s technology has experienced significant growth. New supply partnerships and proactive data sourcing have also meant an increase in devices across key markets, which contribute to the overall 20 percent growth of the EMEA device graph, including a 44 percent increase in the U.K., 47 percent in France, and 85 percent in Germany. “We’re continuing to invest heavily in growing our regional device graph, allowing us to better meet the needs of EMEA marketers as they strive to reach individuals with greater precision in some of the most tightly regulated marketplaces worldwide,” said Tom Rolph, VP EMEA, Tapad. “This year, we have also welcomed 10 new data suppliers whom we’ve helped to increase cross-device amplification, attribution and audience extension, helping to further set us apart in the marketplace and successfully expand our EMEA presence.” Available around the world, the Device Graph provides access to Tapad’s globally compliant and privacy-safe datasets across EMEA, APAC and the U.S., and offers deeper knowledge of consumer preferences, purchase intent, and conversion behaviors. “Tapad has shown a unique ability to adapt to the nuances of the local EMEA market and display impressive growth without sacrificing dedication to privacy,” said Alistair Hill, CEO and Co-founder at On Device Research. “When we started vetting technology vendors, we needed to be sure that we selected a partner that could offer compliant and privacy-safe datasets to operate within our stringent data standards. Tapad’s probabilistic solution offered us greater scale, greater device reach, and increased engagement without compromising on privacy.” For information more about the Tapad Device Graph™, or to request a demo, contact us today. Get started with us
The Tapad Device Graph™ Will Expand Sizmek’s Cross-Device Reach and Improve the Efficiency and Precision of Digital Advertising NEW YORK, November 16, 2017 — Tapad, part of Experian and a leader in cross-device marketing technology, today announced a new global partnership with Sizmek, the largest independent buy-side advertising platform delivering impressions that inspire. By integrating the Tapad Device Graph™, Sizmek will enhance its AI-powered predictive capabilities to deliver accurate, cross-device messaging at global scale in a privacy-safe environment. Combined with Sizmek’s existing data enablement, creative optimization and media execution capabilities, the proprietary Tapad Device Graph improves the efficiency and precision of digital advertising by accurately matching people and devices. This enables advertisers to get a clear view of individual customer journeys, achieve scale without compromising on efficiency, and uncover new opportunities for conversion. Sizmek’s customers will have access to Tapad’s globally compliant and privacy-safe datasets across the Americas, EMEA, and APAC. With deeper knowledge of consumer preferences, purchase intent and conversion behaviors, Sizmek and its customers are able to enhance advertising strategies including cross-device audience identification and more. “Tapad is known for their strong cross-device capabilities, and their offering is an excellent addition to our growing program for best-of-breed data and measurement partners" says Mike Caprio, Sizmek’s Chief Growth Officer. “For our customers, this partnership will add further people-based marketing precision and reach to our comprehensive offerings around creative optimization, data enablement and media execution." “Sizmek’s adoption of industry-leading AI and machine learning campaigns will be a great complement for the Device Graph,” said Chris Feo, SVP, strategy & global partnerships at Tapad. “Our ability to create smaller, more customized segments in conjunction with Sizmek’s AI modeling will deliver efficiency, effectiveness and increased ROI for marketers worldwide.” This partnership comes at a time of a massive shift in the marketing technology industry. Companies like Tapad and Telenor, as well as Rocket Fuel and Sizmek, are joining forces to adopt those technologies that are most efficient and accurate at reaching consumers at scale in a personalized and non-intrusive way. The combination of Tapad and Sizmek’s offerings will provide international marketers with exceptional resources to lead a more cost effective and results driven campaign. For information more about the Tapad Device Graph™, contact us today. Get started with us

The Tapad Device Graph™ increases Throtle’s amplification by 475 percent. NEW YORK, Nov. 1, 2017 /PRNewswire/ — Tapad, now a part of Experian, the leader in cross-device marketing technology, today announced a partnership with Throtle, a leading data onboarding company. The Tapad Device Graph™ will enhance Throtle's best-in-class onboarding capabilities by providing accurate and privacy-safe cross-device reach as well as precise audiences at scale. In partnership with Tapad, Throtle will deterministically link its services to a corroborated individual with hundreds of targeting attributes. This linkage allows Throtle to offer true cross-device identity management and identity resolution services to accompany its robust onboarding capabilities. Throtle will also work with Tapad to validate its device graph, building larger, more comprehensive audience segments. To date, the Tapad Device Graph™ has connected 61 percent of Throtle IDs to related ones in the graph, with an average amplification rate of 475 percent for Throtle's IDs, or 4.8 new IDs per each of Throtle's. Throtle has also seen its overall match rates involving Tapad's identity insights rise an average of 15 percent since the inception of the partnership. More specifically, Tapad's mobile advertising IDs (MAIDs) have increased Throtle's in-app identity inventory by 35 percent. "Tapad has proven to be a trusted source for cross-device matching and has a tremendous reputation in the advertising and marketing technology industries for delivering superior precision and scale with the utmost dedication to privacy," says Paul Chachko, CEO, Throtle. "Since we first began our test phase, and continuing through to this day, Tapad has met and exceeded our expectations for what a partner should be." With Tapad's strong commitment to precision and accuracy, Throtle was confident that this partnership would prove to be the right choice for the strategic expansion of its platform. Not only does Tapad deliver in-depth insights, parsing deterministic from probabilistic linkages, but its pool of device-level touchpoints enables Throtle to increase scale without seeing a decline in precision. "Accuracy and precision are core characteristics of our proprietary Device Graph," explains Chris Feo, SVP, Strategy & Global Partnerships, Tapad. "When Throtle approached our team, we knew we would be the right partner to assist their leading onboarding technology. We're excited to work with Throtle to achieve cross-device reach, audience scale and precise deterministic and probabilistic linkages for its clients." For more information about the Tapad Device Graph™, or to request a demo, visit https://www.experian.com/marketing/consumer-sync About TapadTapad Inc. is a marketing technology company renowned for its breakthrough, unified, cross-device solutions. The company's signature Tapad Device Graph™ connects millions of consumers across billions of devices. The world's largest brands and most effective marketers entrust Tapad to provide an accurate, privacy-conscious, and unified approach to connecting with consumers across screens. In 2015, Tapad began licensing the Tapad Device Graph™ and swiftly became the established gold-standard throughout the ad tech ecosystem. Tapad is based in New York and has offices in Boston, Chicago, Dallas, Detroit, London, Los Angeles, Miami, Oslo, San Francisco, Singapore, and Tokyo. Tapad's numerous awards include: Forbes' Most Promising Companies, Deloitte's Technology Fast 500, Crain's Fast 50, TMCnet Tech Culture Award, and Global Startup Award's "Startup Founder of the Year". In 2016, Tapad was acquired by the Telenor Group, one of the world's largest mobile operators. About ThrotleThrotle is a data onboarding company focused on deterministic matching and identity resolution, empowering brands with true individual-based marketing. Our data centric onboarding approach guarantees the highest level of accuracy, scale, and responsiveness for our clients. For more information on Throtle, please visit, throtle.io. Contact us today!